Visor is an officially listed Atlassian Marketplace app for Jira.
Visor’s Jira Data Visualization Tool Drives Stakeholder Alignment
Quick and Easy Jira Integration Setup
Visor provides a secure connection to Jira with fewer steps than other apps. Import your nested Jira data in just a few minutes. Visor also supports JQL.
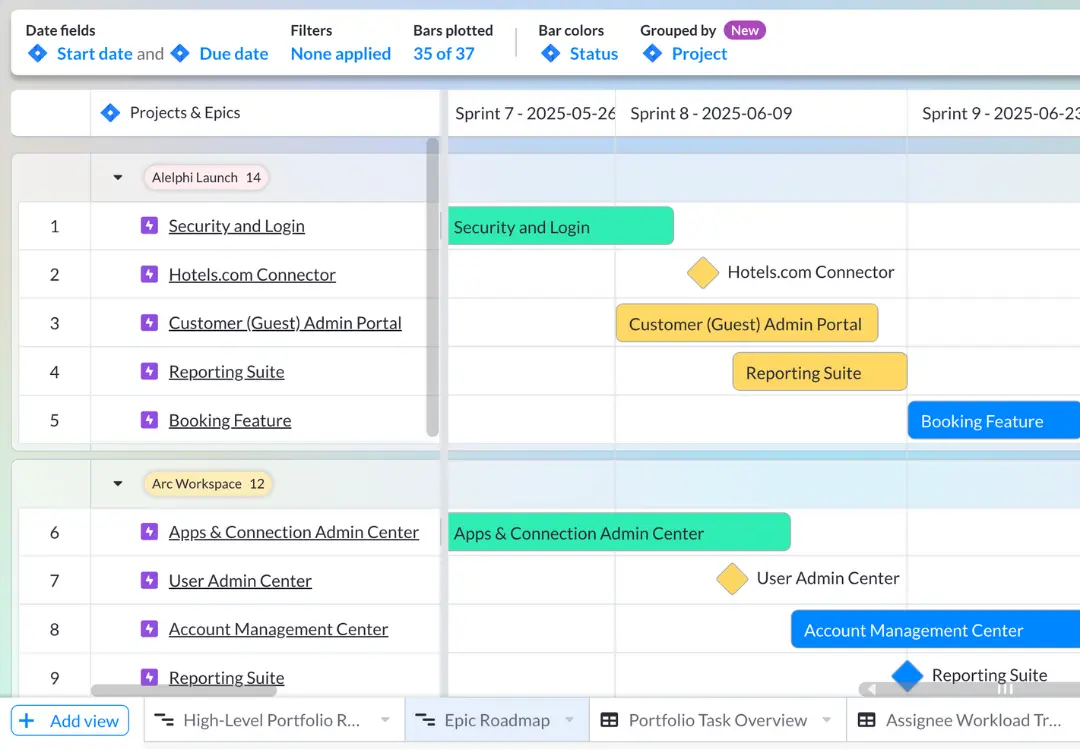
Use Visor’s AI to automatically generate a full range of fully configured, beautiful, crystal clear visualizations of your Jira data, including Gantt charts, table views and more. AI does the heavy lifting to save you time and effort, so your team can focus on value-generating tasks.
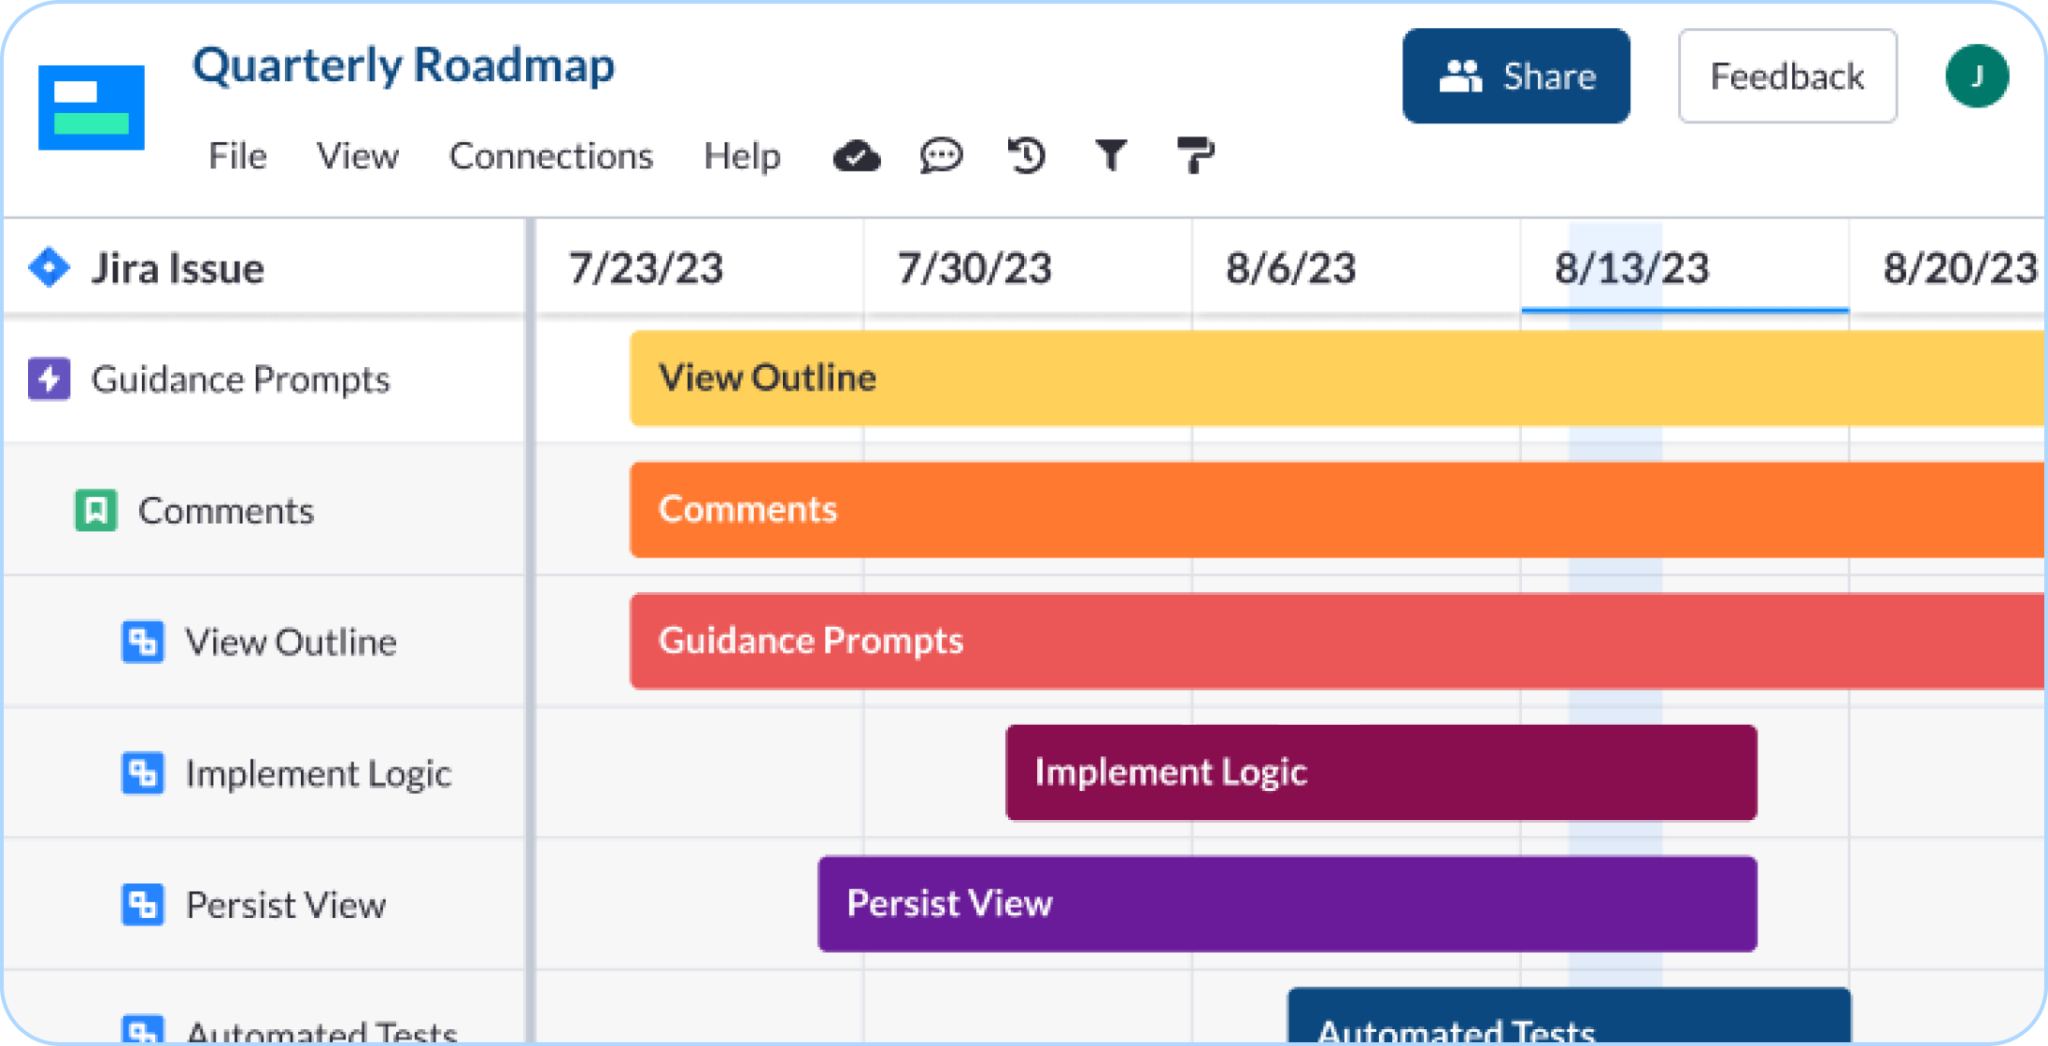
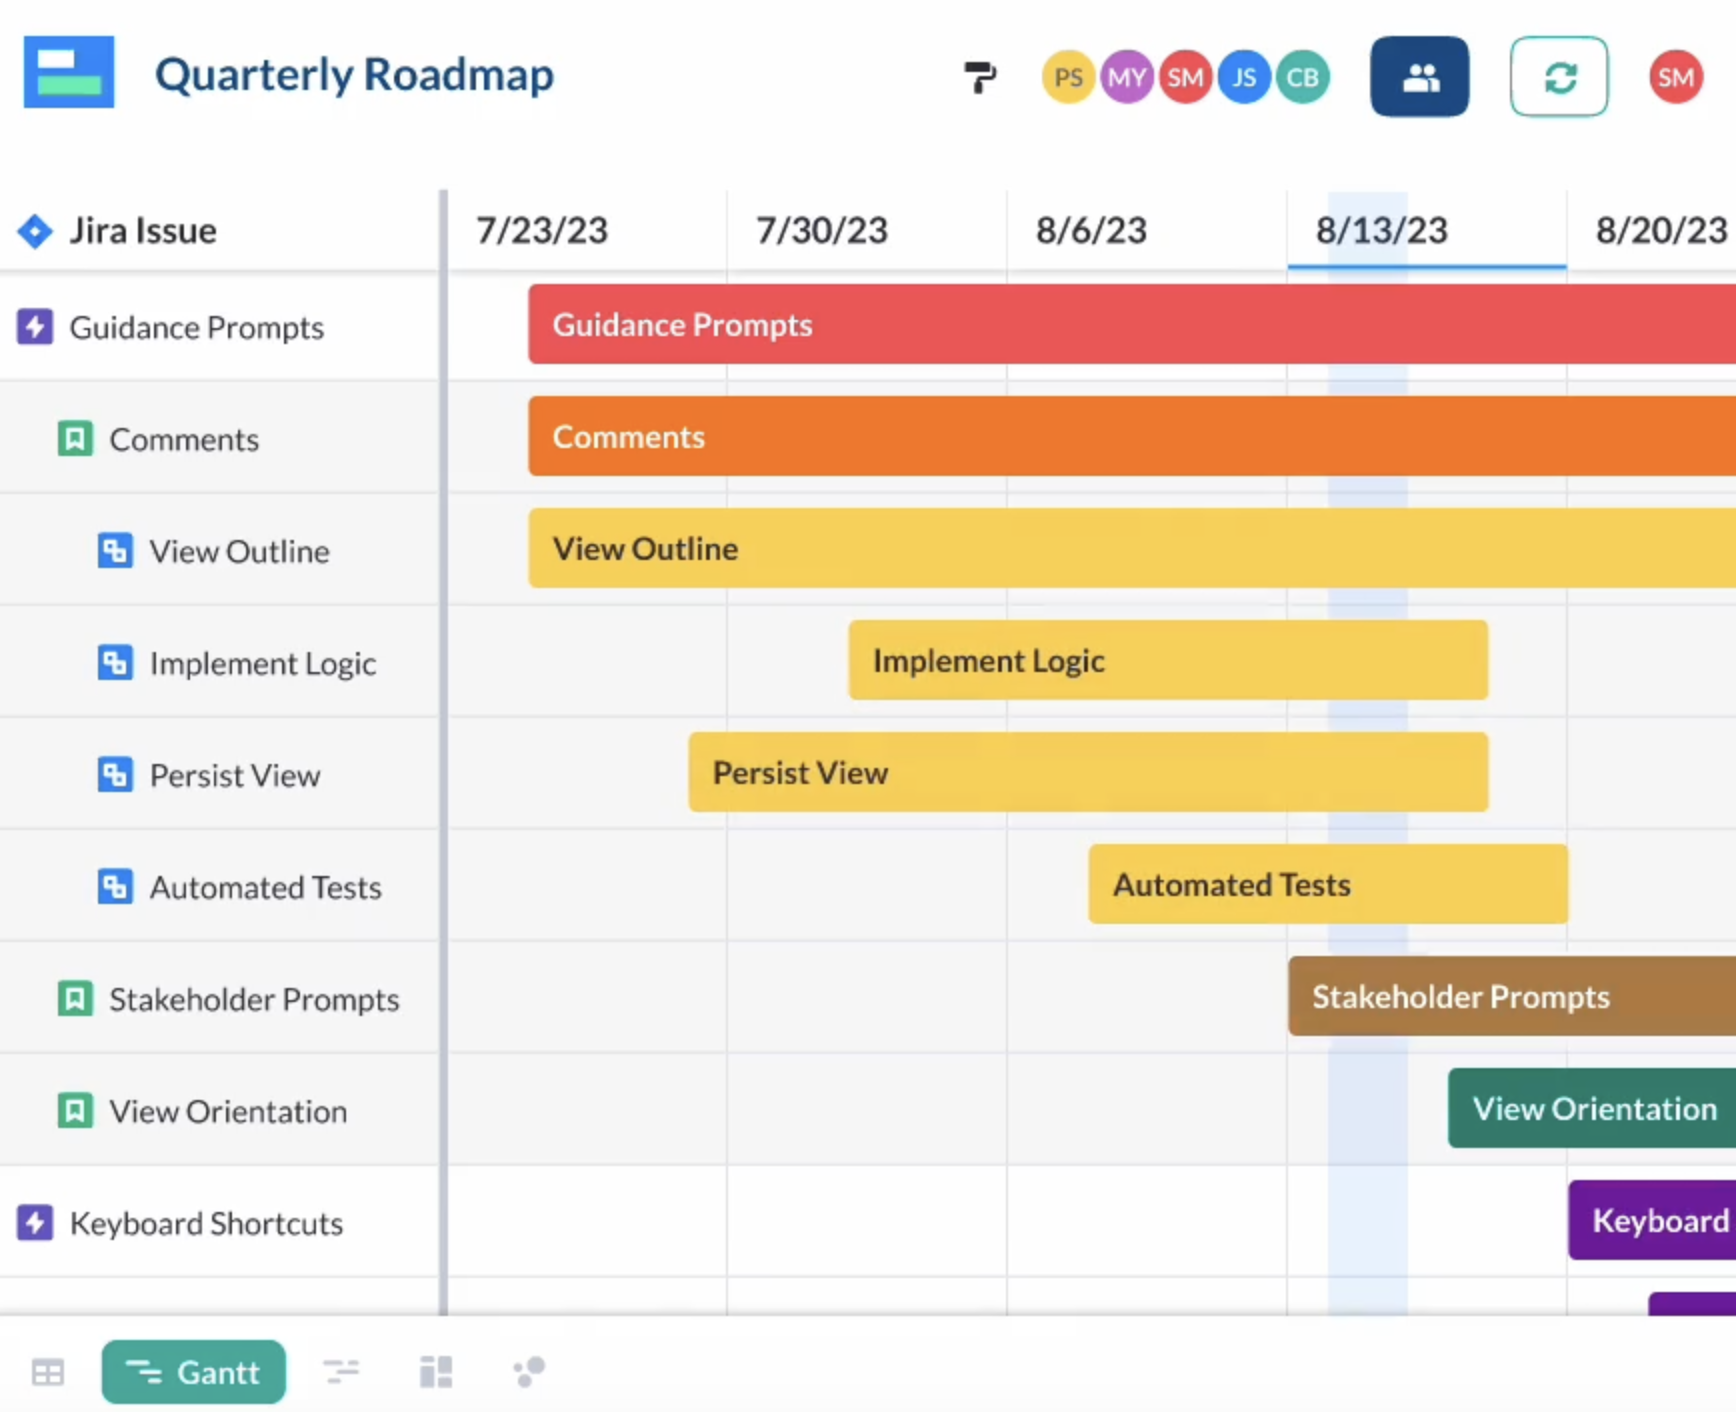
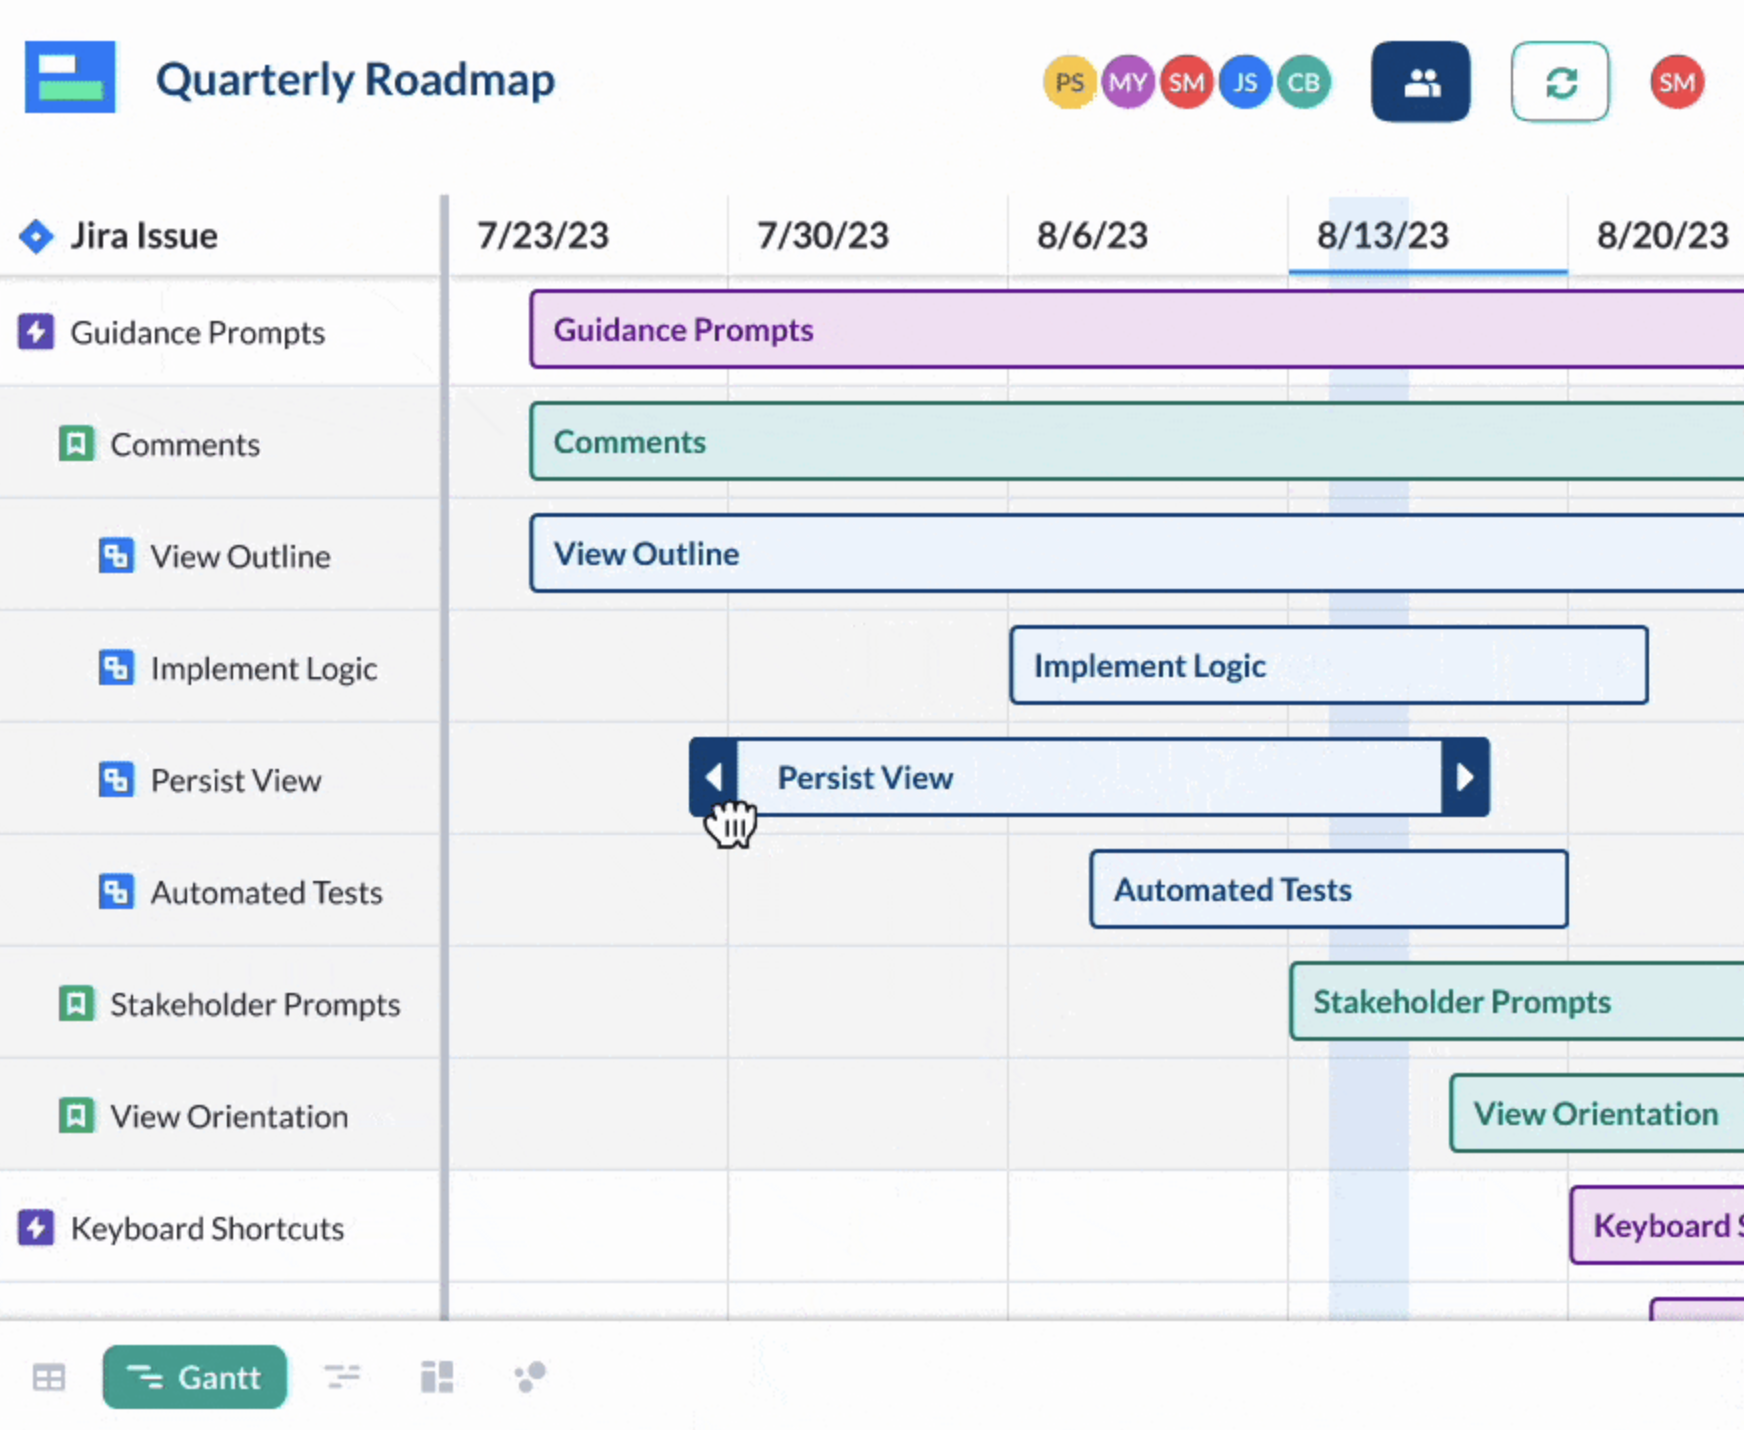
Visor stays in sync with Jira, allowing you to visualize data hierarchies (e.g., epics, stories, tasks, substasks). Add filters to help stakeholders get the right level of detail.
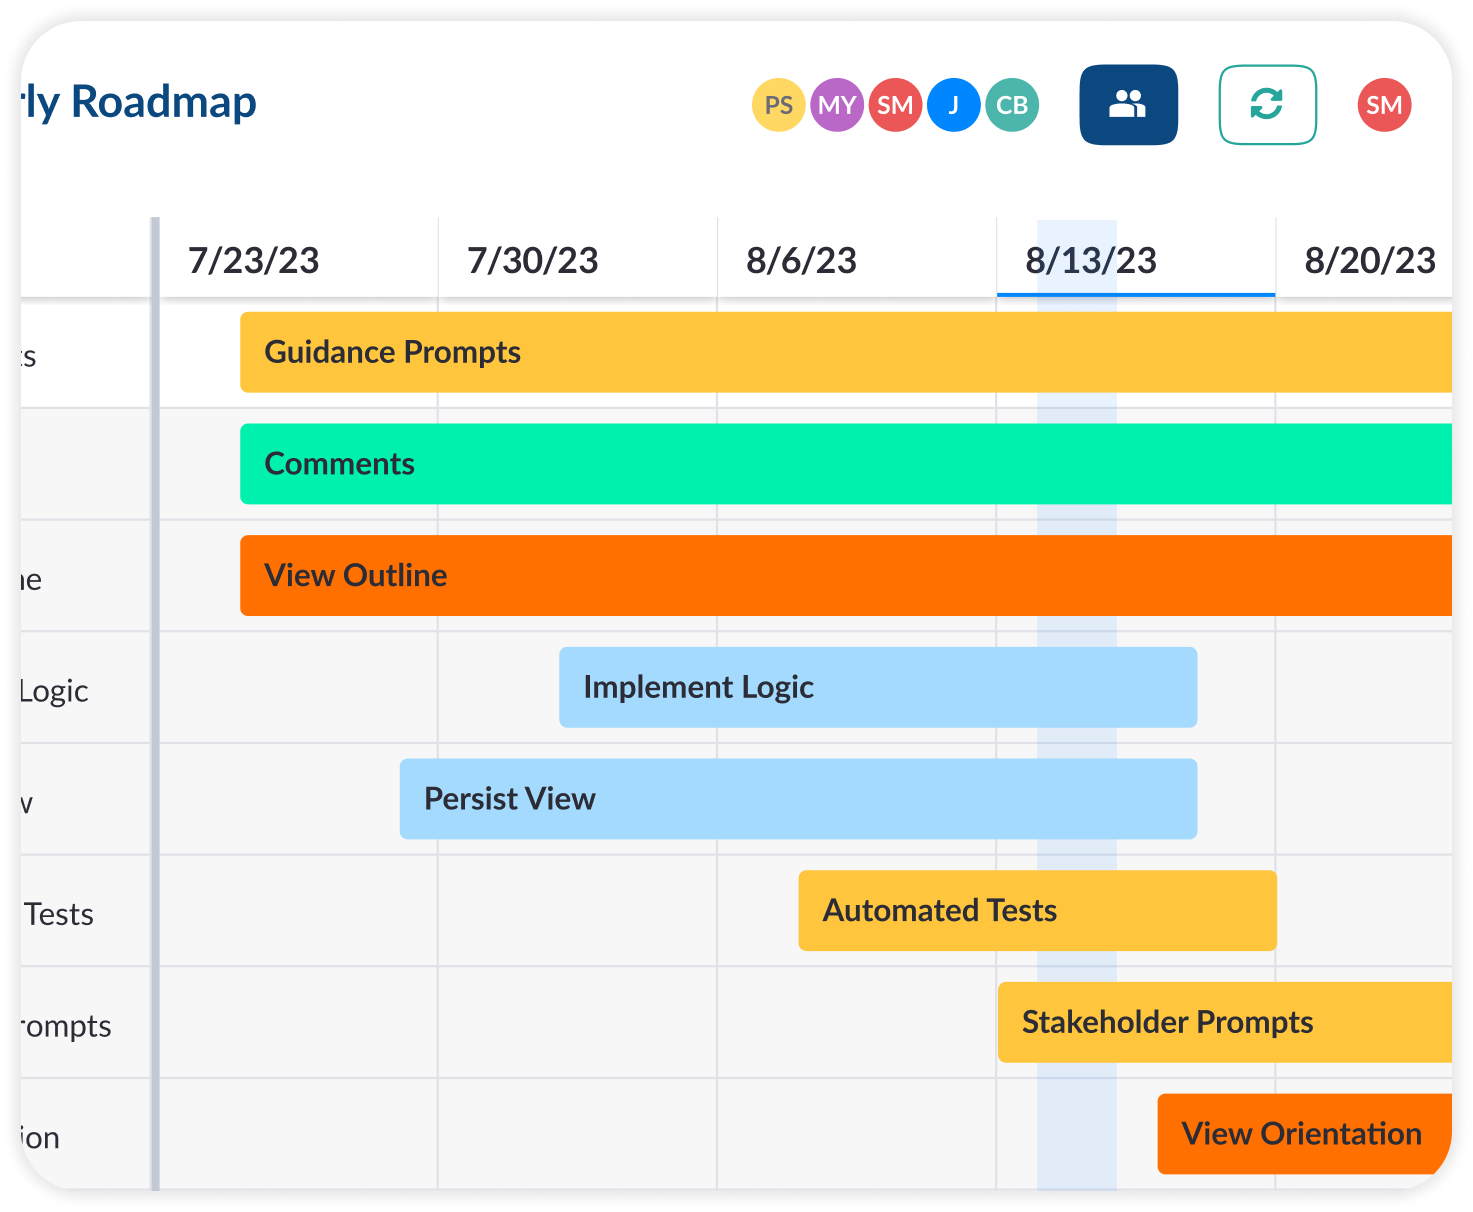
Visor provides an intuitive interface that makes creating a Gantt easy. Add color with conditional formatting to make your chart easy to understand at first glance.
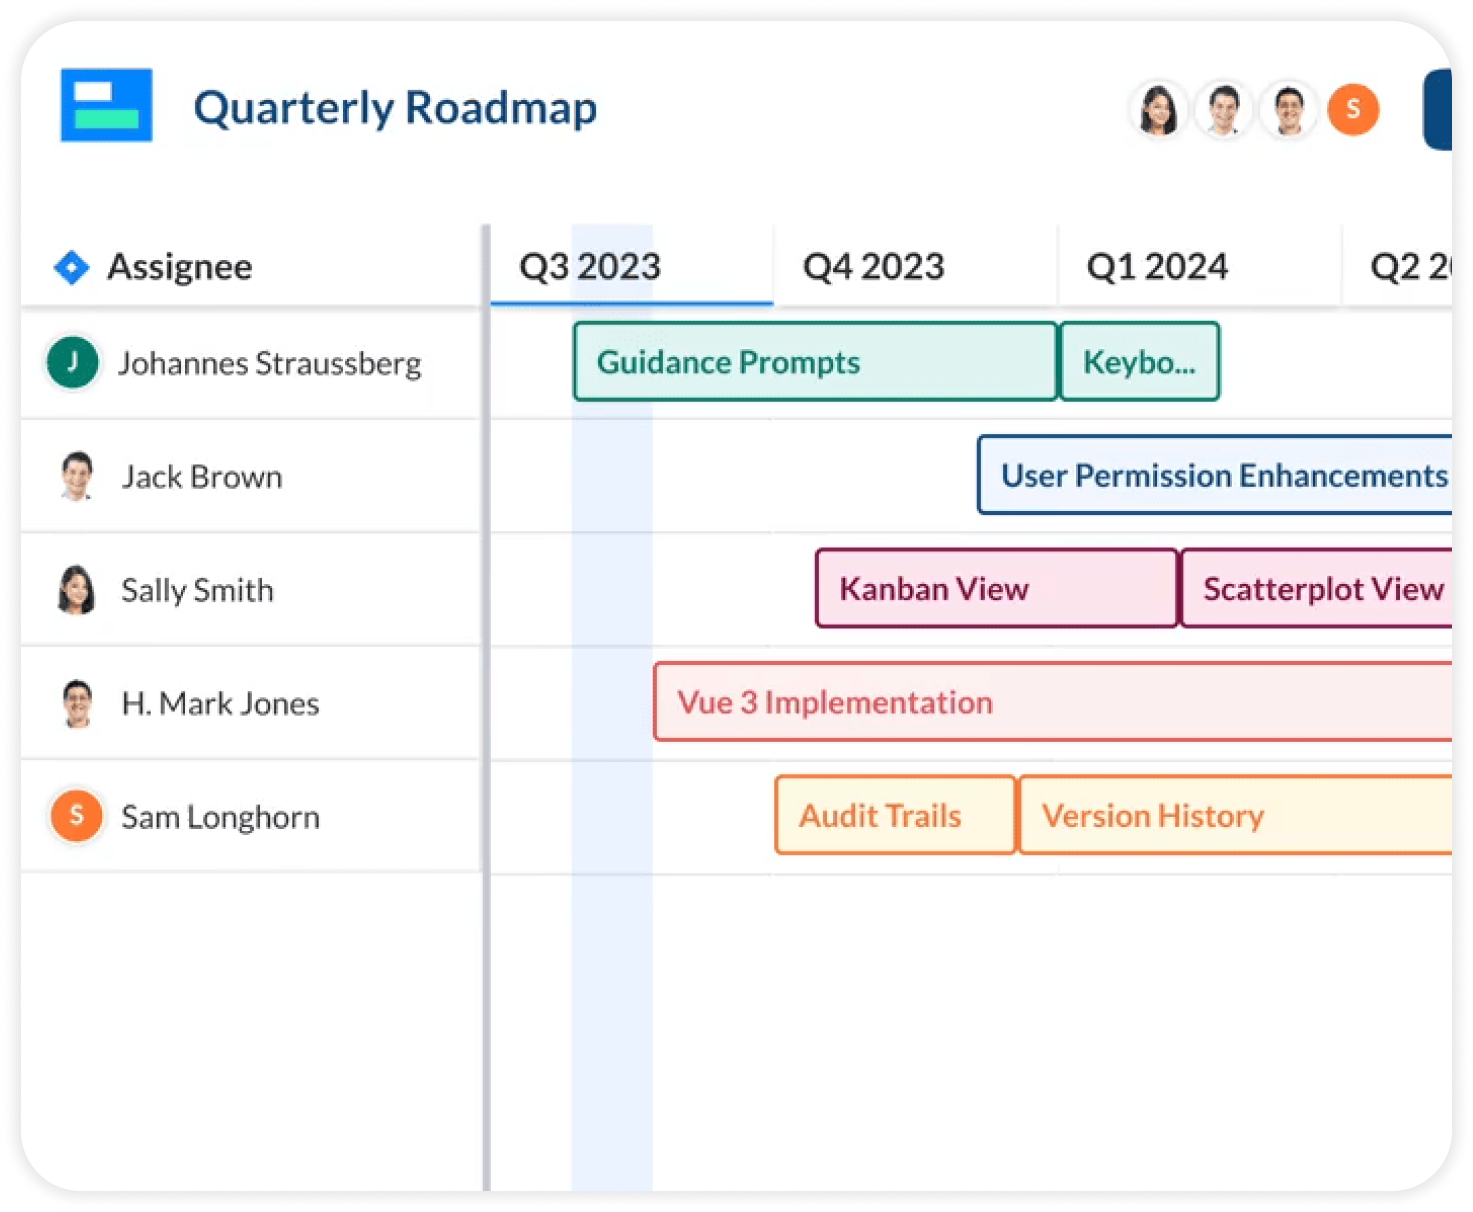
Visor’s filtering and formatting makes it easy to create different views for different audiences. Unlimited view-only access makes sharing easy and economical.
To provide the best experiences, we use technologies like cookies to store and/or access device information. Consenting to these technologies will allow us to process data such as browsing behavior or unique IDs on this site. Not consenting or withdrawing consent, may adversely affect certain features and functions.
Functional Always active
The technical storage or access is strictly necessary for the legitimate purpose of enabling the use of a specific service explicitly requested by the subscriber or user, or for the sole purpose of carrying out the transmission of a communication over an electronic communications network.
Preferences
The technical storage or access is necessary for the legitimate purpose of storing preferences that are not requested by the subscriber or user.
Statistics
The technical storage or access that is used exclusively for statistical purposes.The technical storage or access that is used exclusively for anonymous statistical purposes. Without a subpoena, voluntary compliance on the part of your Internet Service Provider, or additional records from a third party, information stored or retrieved for this purpose alone cannot usually be used to identify you.
Marketing
The technical storage or access is required to create user profiles to send advertising, or to track the user on a website or across several websites for similar marketing purposes.
To provide the best experiences, we use technologies like cookies to store and/or access device information. Consenting to these technologies will allow us to process data such as browsing behavior, to improve the performance of this website.
Functional Always active
The technical storage or access is strictly necessary for the legitimate purpose of enabling the use of a specific service explicitly requested by the subscriber or user, or for the sole purpose of carrying out the transmission of a communication over an electronic communications network.
Preferences
The technical storage or access is necessary for the legitimate purpose of storing preferences that are not requested by the subscriber or user.
Statistics
The technical storage or access that is used exclusively for statistical purposes.The technical storage or access that is used exclusively for anonymous statistical purposes. Without a subpoena, voluntary compliance on the part of your Internet Service Provider, or additional records from a third party, information stored or retrieved for this purpose alone cannot usually be used to identify you.
Marketing
The technical storage or access is required to create user profiles to send advertising, or to track the user on a website or across several websites for similar marketing purposes.