Complete Asana Gantt Chart Guide – How To’s and Alternatives


Start using Visor today
- Visualize all your projects and data

- Roll up multiple projects into portfolio views
- Try Visor for FREE
Asana’s Gantt charts are a great way to plan and manage your Asana projects.
You can also use integrated apps and plugins to create Gantt charts for your Asana projects or portfolios of projects.
People connect Gantt chart apps and plugins with Asana because Asana’s native Gantt chart functionality has some limitations, especially around including multiple projects in a Gantt. However, Asana’s built-in Gantt charts do work well for quite a few use cases. I will cover them in this post, along with how to overcome their limitations.
In this article, you’ll learn:
- How to create Gantt charts in Asana
- Tips and tricks to make the best Asana Gantt charts
- The limitations of Gantt charts in Asana
- Apps or plugins you can use to address these limitations
If you want to create gorgeous Gantt charts for your Asana project portfolio that have extra functionality, try Visor for free.
Does Asana Have Gantt Charts?
Yes, Asana has a native Gantt chart view that you can use to visualize, plan, and make changes to your project. The built-in Gantt chart feature offers important features like dependencies and Asana milestones.
Gantt charts aren’t included in the Asana Free plan, so you’ll need to sign up for the Asana Starter plan at a minimum.
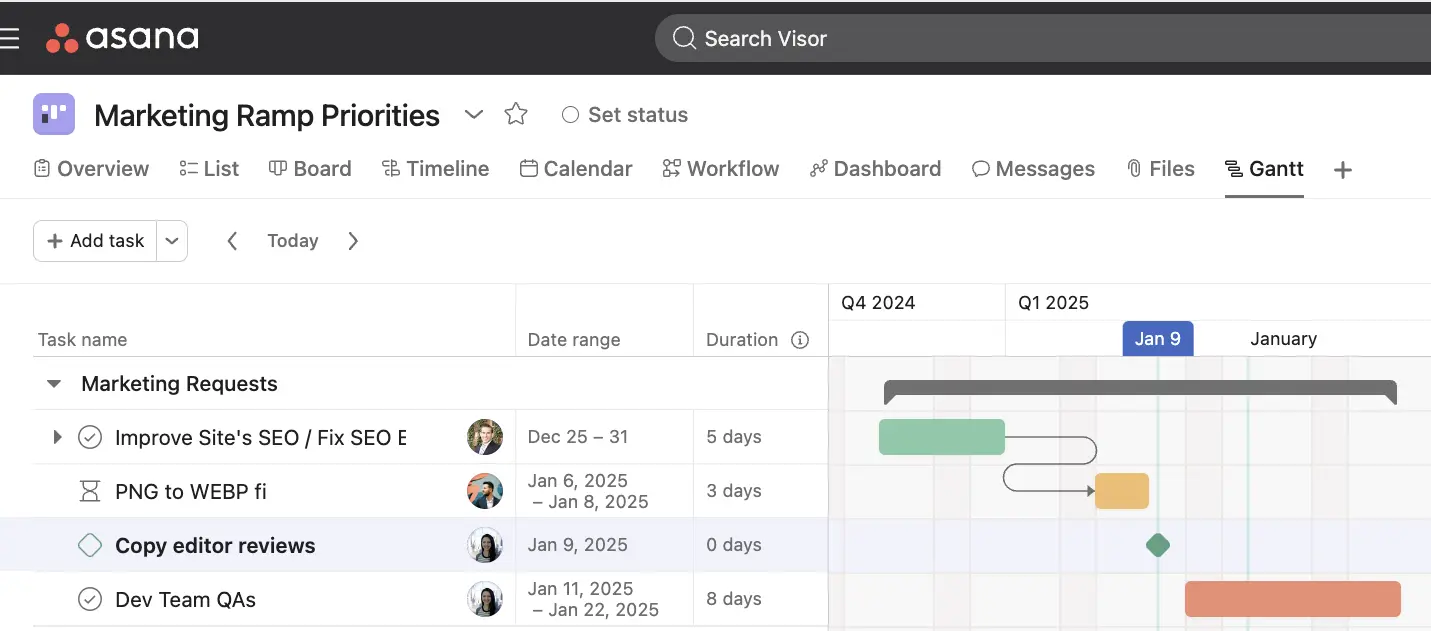
Example of an Asana Gantt Chart:

What Features Do Asana Gantt Charts Include?
Here are the key features of Gantt charts in Asana:
- Milestones: Gives you the ability to set important points in your project as milestones on your Gantt chart.
- Critical path: The critical path method highlights the series of tasks which directly determine the project’s completion date (typically the most significant tasks in the project).
- Dependencies: Displays links between tasks on the Gantt chart. You can decide whether a buffer is set between dependent tasks so that when you move one task, the dependent tasks also move automatically to maintain that buffer.
- Baselines: Enables you to compare task progress and due dates against planned dates.
Line connecting tasks indicate a dependency; the triangle indicates a milestone in Asana’s Gantt:
Overall, Asana’s Gantt charts are a basic and functional Gantt chart.
Using Asana’s Gantt chart view, you can automatically generate Gantt charts based on projects planned out using other Asana views (e.g., Asana’s Board or List view), or you can use the Gantt chart view itself to add tasks, schedule them, and allocate them.
However, more advanced users might find that there is a need for more advanced Gantt options, which explains why Instagantt is popular for Asana users, along with other tools in the Asana Marketplace like Visor’s Gantts for Asana Portfolio Management).
Is There An Additional Cost For Gantt Charts in Asana?
Yes, at least if you’re on an Asana Free plan, because Asana’s Gantt chart view is only included with the Starter plan and above.
Asana’s Starter plan costs $13.49 per user per month or $10.99 per user per month if you pay annually upfront.
You can’t buy single licenses, either. Instead, you must purchase licenses in groups of two or five. So, in reality, if you have just two Asana users, the minimum you need to spend per year for Asana with native Gantt charts is $324 per year if you pay per month or $264 if you pay upfront.
Asana Timeline vs Gantt Chart
Many people confuse timelines and Gantt charts, especially in Asana, where the Gantt chart view is relatively new (it was added in 2022). Both Asana’s Timeline and Gantt views are only available to paying users.
Let’s first explore what exactly goes into a Gantt before showing you what makes the Timeline different.
Below you’ll see what most Gantt charts (including Asana Gantt charts) have. The example below is a Gantt using Asana data and Visor’s Gantt chart template.
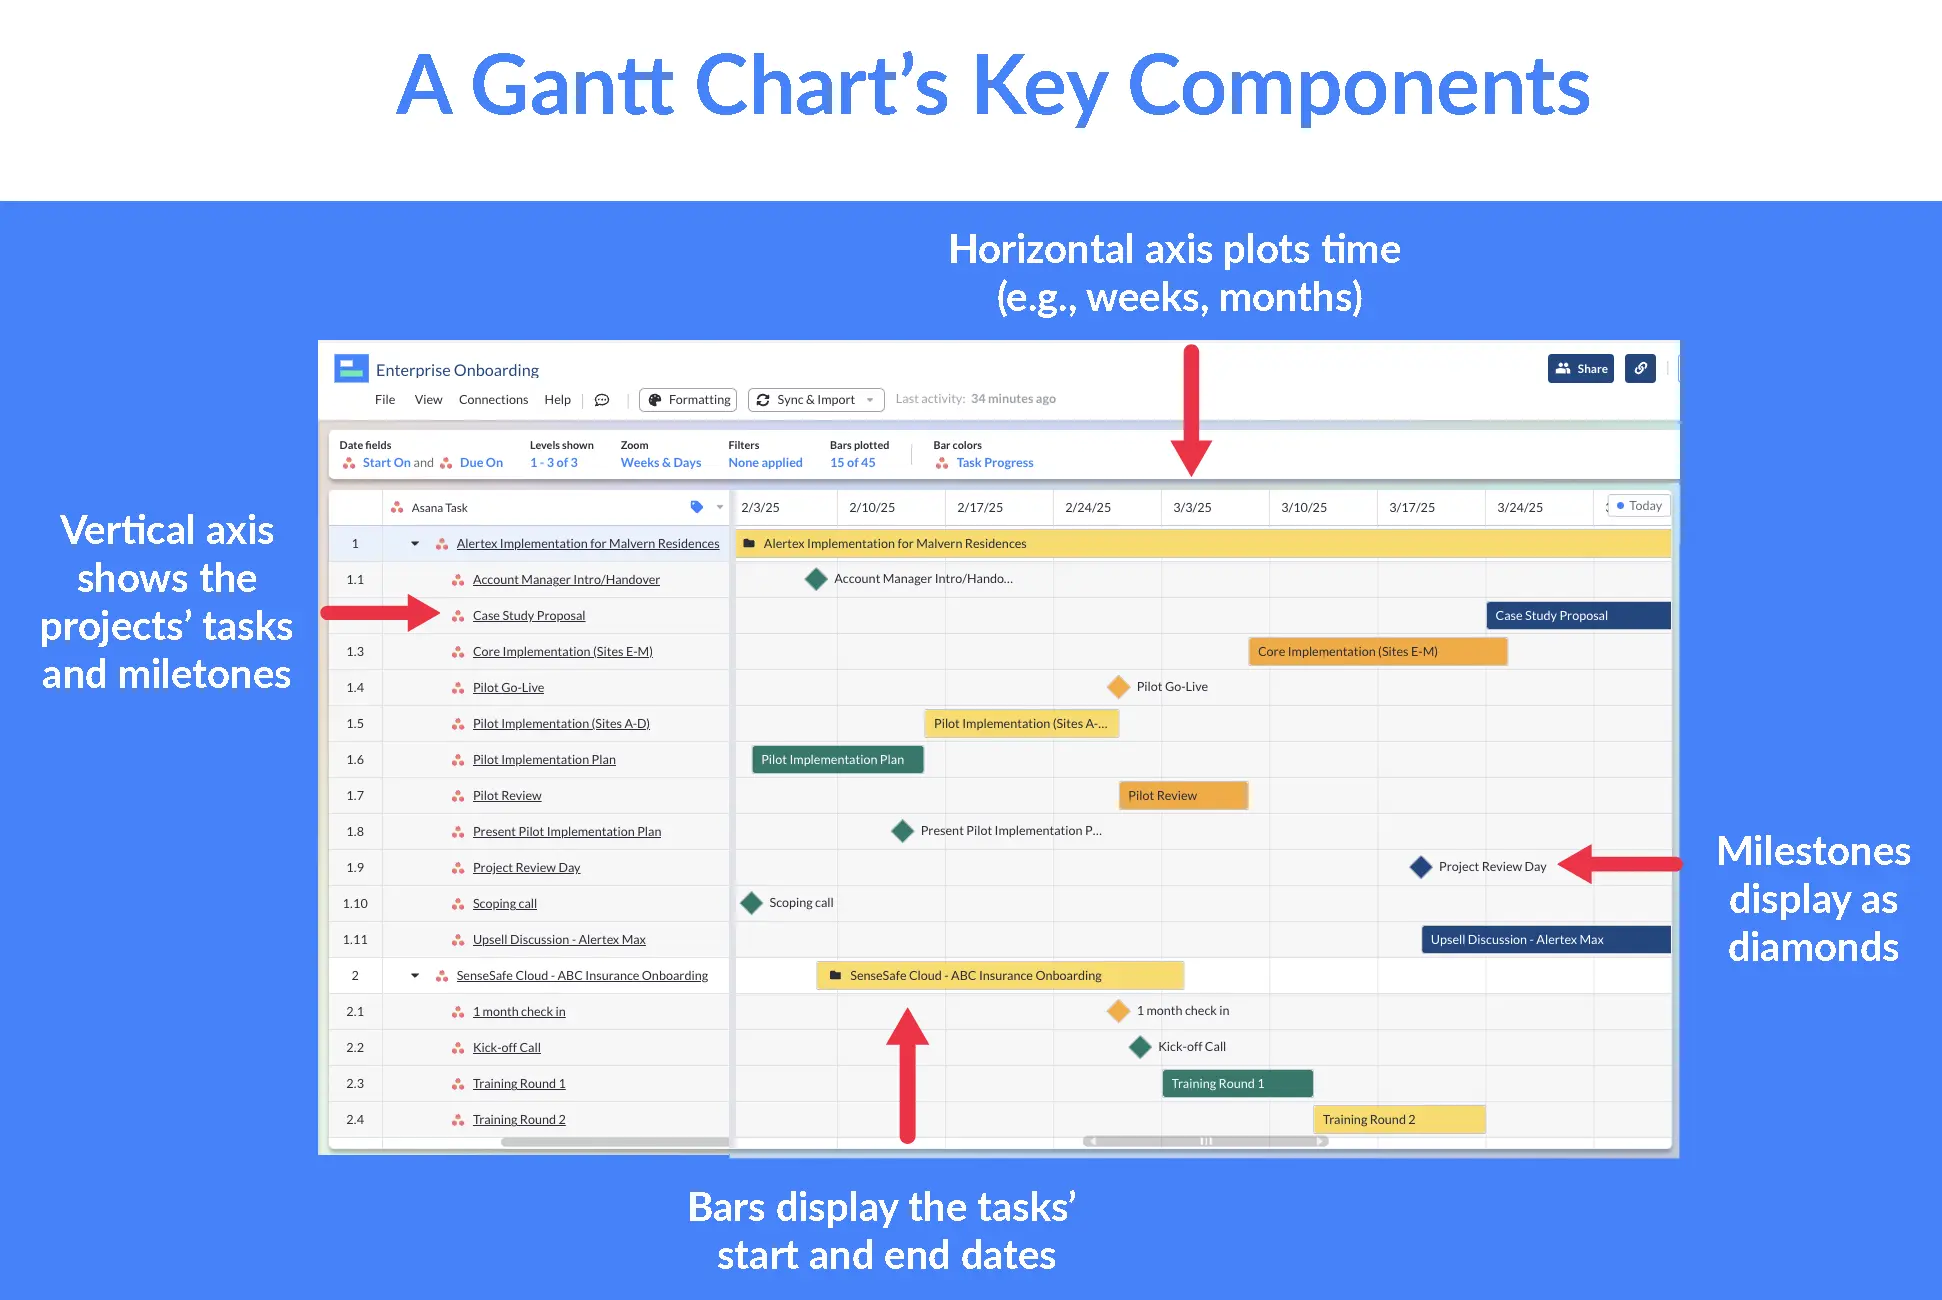
The Difference Between Asana Gantt and Asana Timeline
As you can see, the vertical axis in a Gantt typically shows to the projects’ tasks.
However, Asana’s Timeline, instead, has the tasks categorized by the status (.e.g, “In progress,” “Complete,” “Marketing Requests”). These categories are called “Swimlanes.”
Example of Asana Timeline:
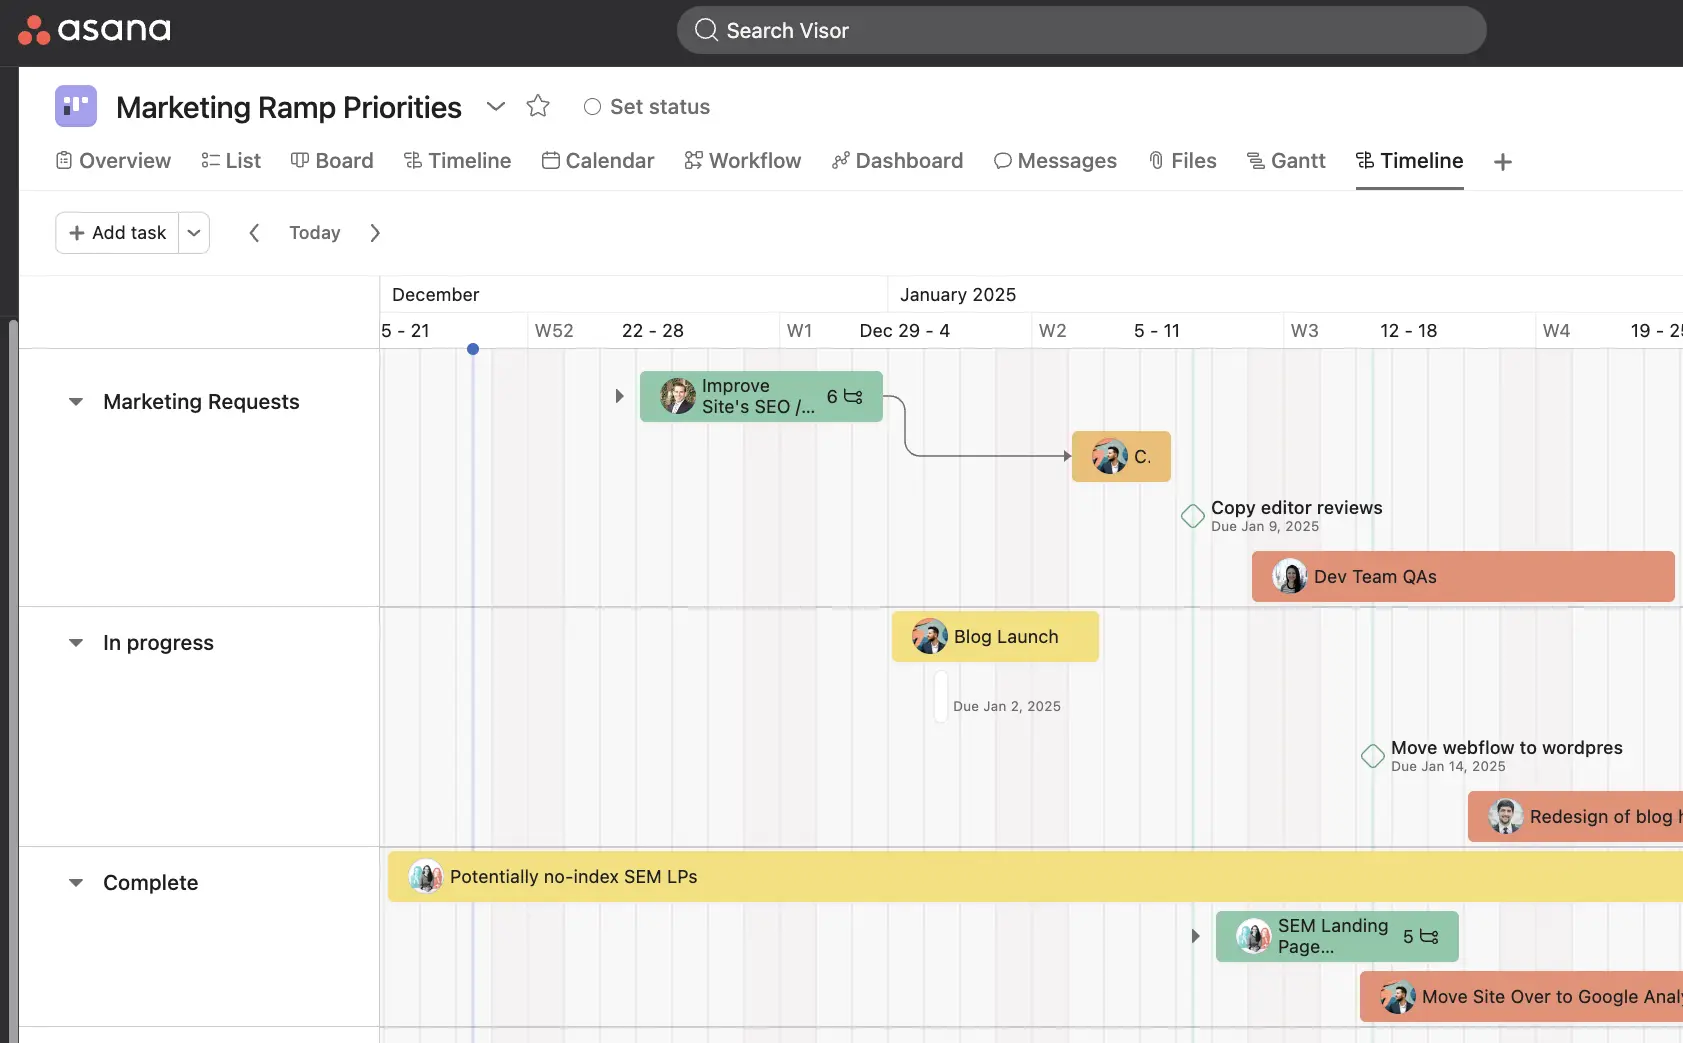
Also, the bars show the people who will do the tasks contained within each swimlane.
Interesting, this Timeline is using the same project data as the Gantt chart above. However, the way it shows data is different and better for resource or capacity planning.
Asana Gantt Chart Is More Robust Than Timeline
Overall, Asana’s Gantt chart offers more features than the Timeline chart.
Features not available in Timeline (but are in Asana’s Gantt):
- Dependencies between tasks
- Milestones
- Critical path visualization
- Nesting of subtasks below tasks
- Columns for additional context and structure
Gantt charts show more detail and visualize the relationship between different tasks in a project. Read more about this in our post about Timelines vs Gantt charts.
Asana Gantt Chart Limitations
Here are the most common complaints or requests for additional functionality in Asana’s Gantt chart view, based on forum posts and my own experience:
- Inability to add, remove, or change Gantt chart columns
- Lack of project portfolio Gantt charts
- Tasks below the subtask level are not shown
- Lack of roll up calculations on the Gantt chart
Read below to learn more about each piece of functionality and why you might need them when creating and using Gantt charts of your own.
Changing or Adding Columns
One of the main ways a Gantt chart differs from a Timeline is that it has vertical axis / columns to the left that provide additional information about the corresponding task.
In most Gantt chart views, you can modify, remove, and add columns to Gantt charts so that you can show the information that is most important in your project or for particular stakeholders. Unfortunately, you can’t add, remove, or customize the columns on Asana Gantt chart views.
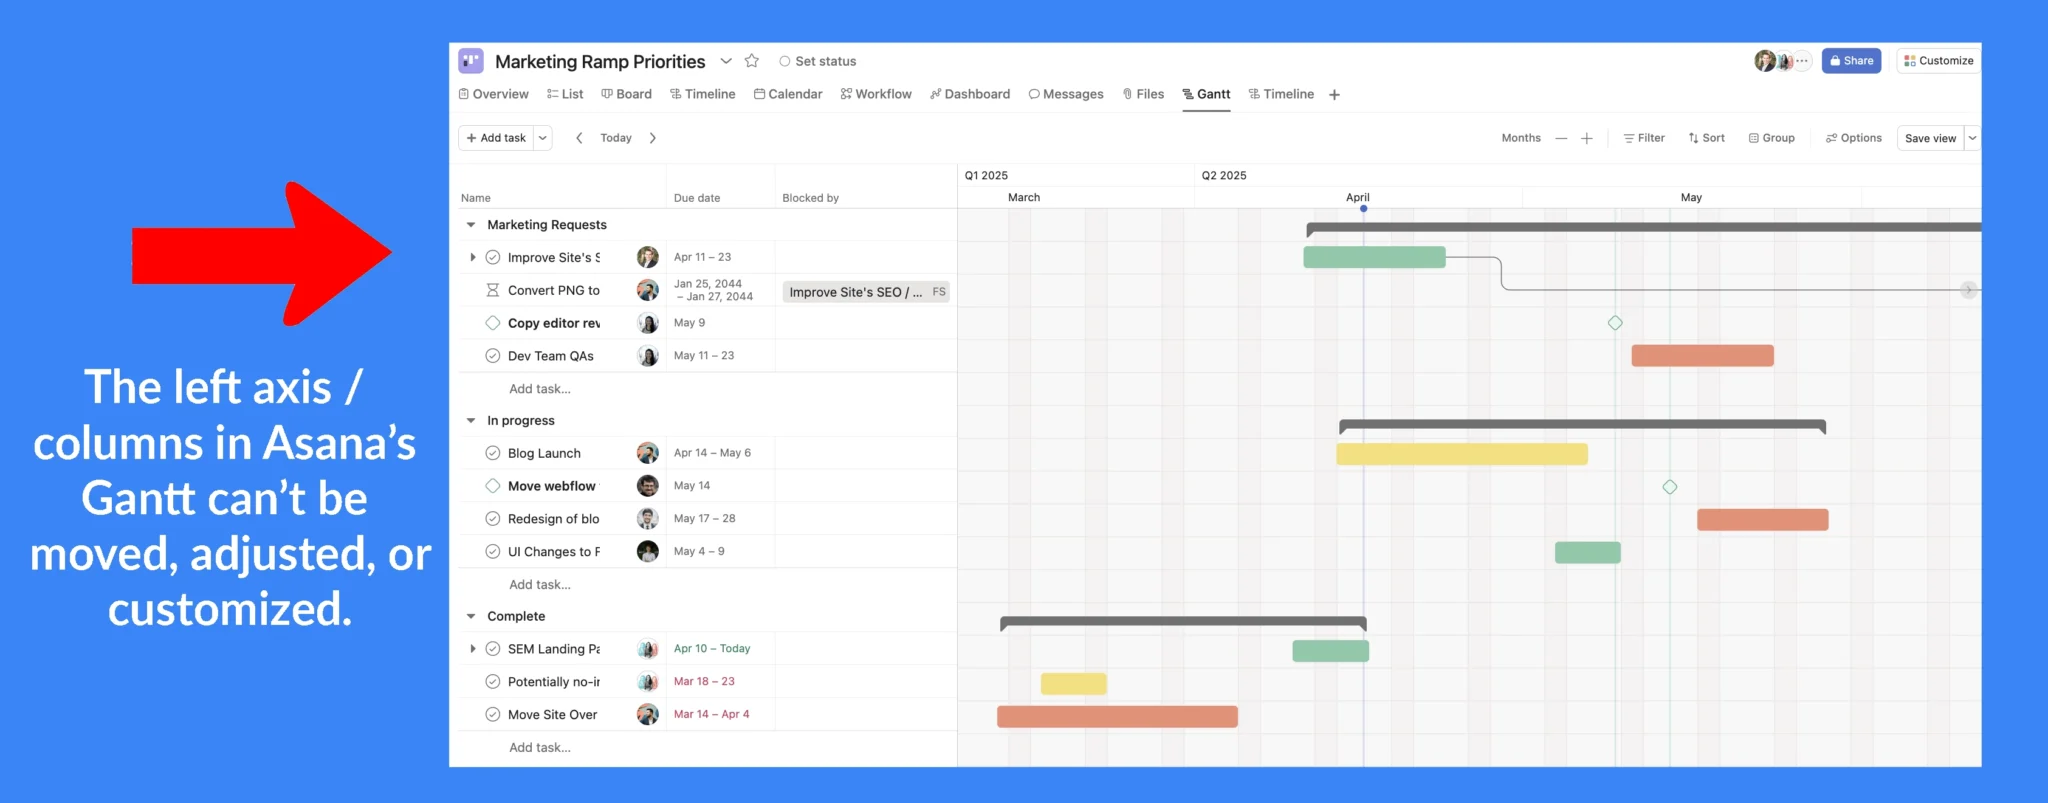
This is a frequent and understandable source of complaints from Asana users in forums, but this requirement is still unaddressed at the time of writing.
Fortunately, you can use Visor to create fully customizable Gantt charts for your Asana projects (and portfolios of projects). In Visor Gantt charts, you can:
- Change the primary column on a Gantt chart
- Add additional columns to show different or additional information
- Remove columns that are irrelevant to your project or to specific stakeholders
- Create and share Gantt charts with different columns for specific purposes or stakeholders
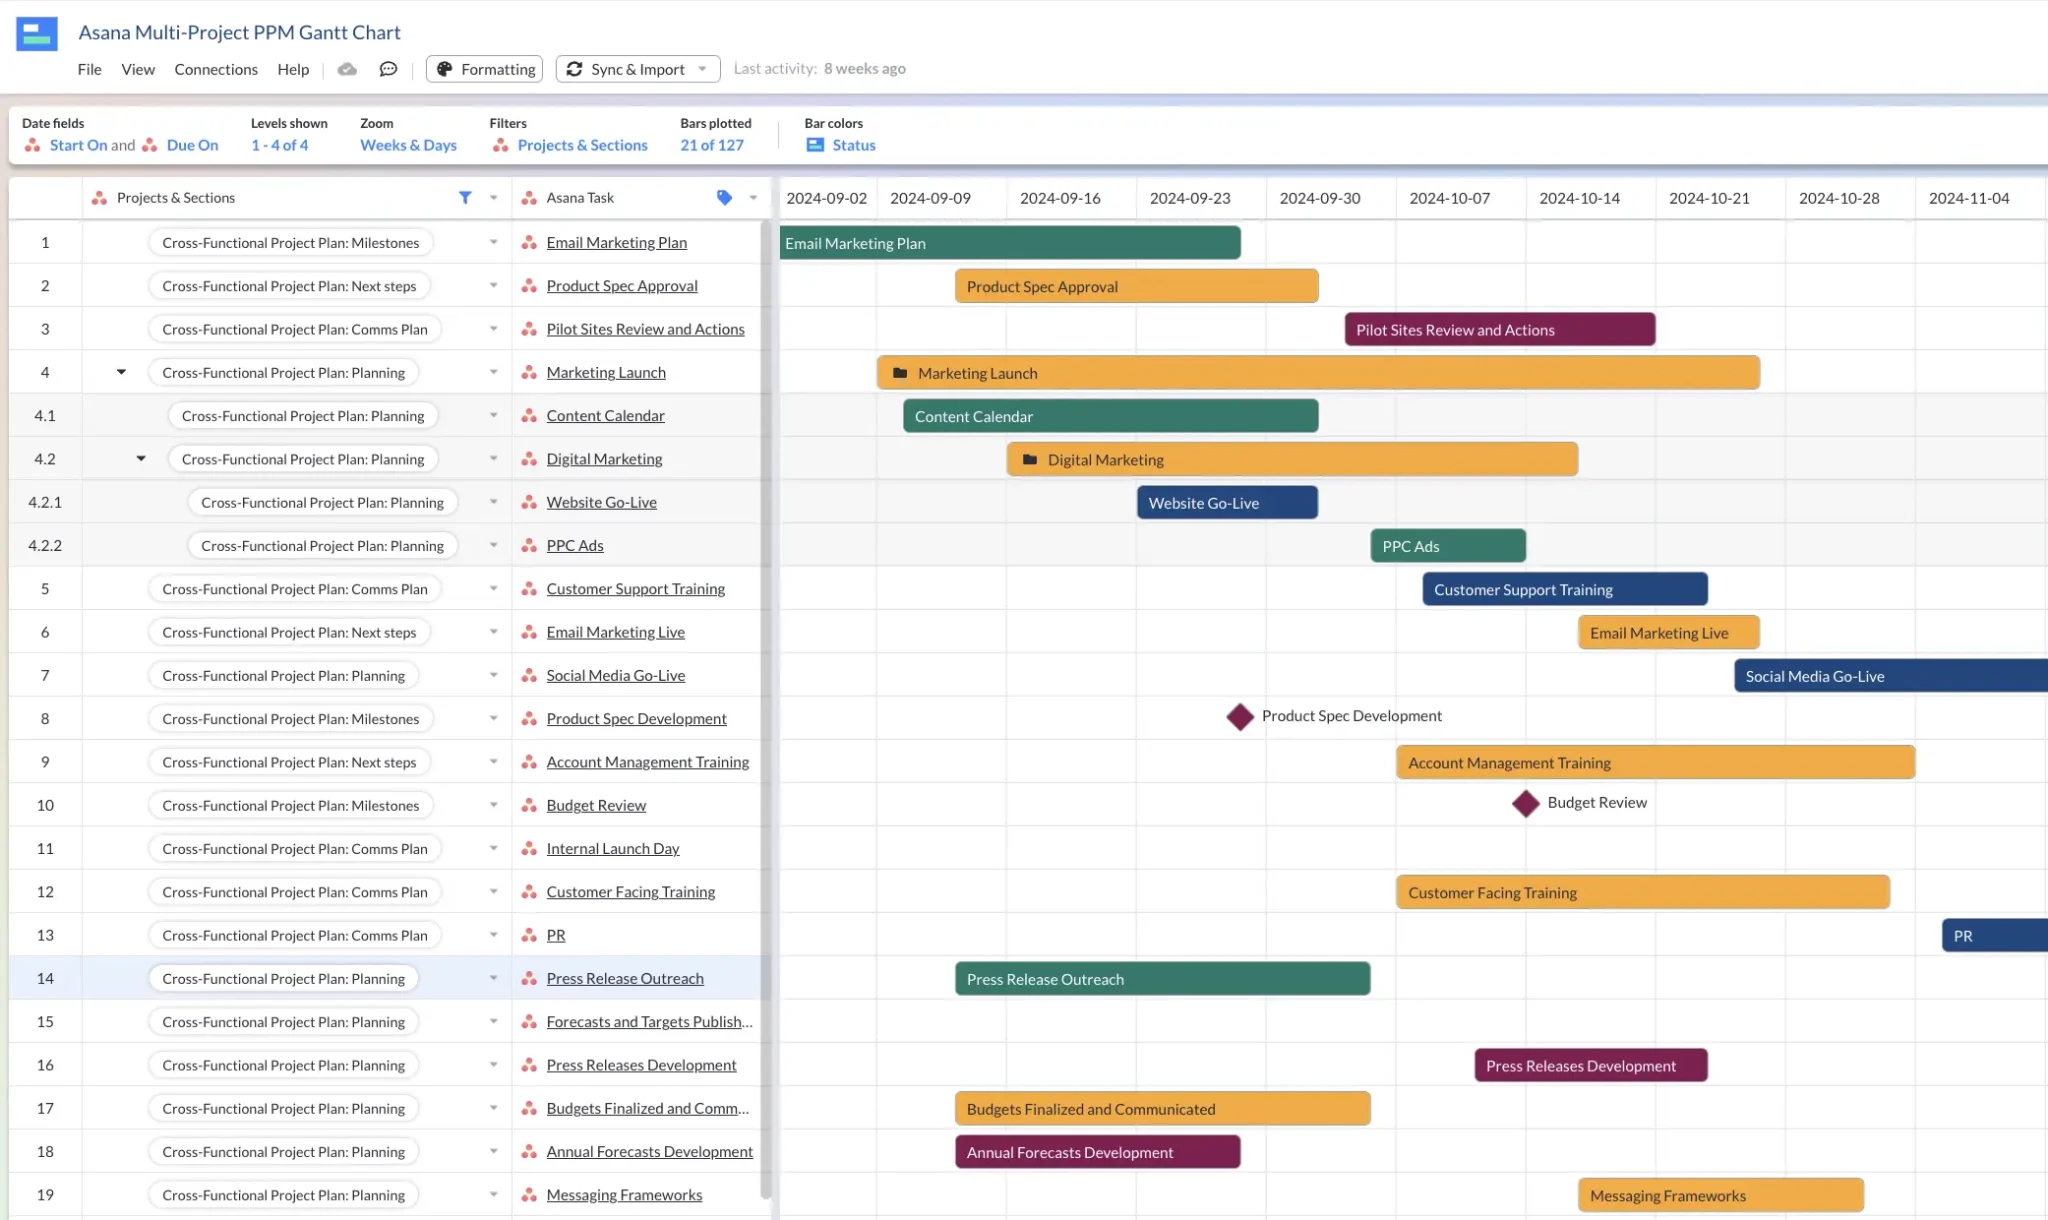
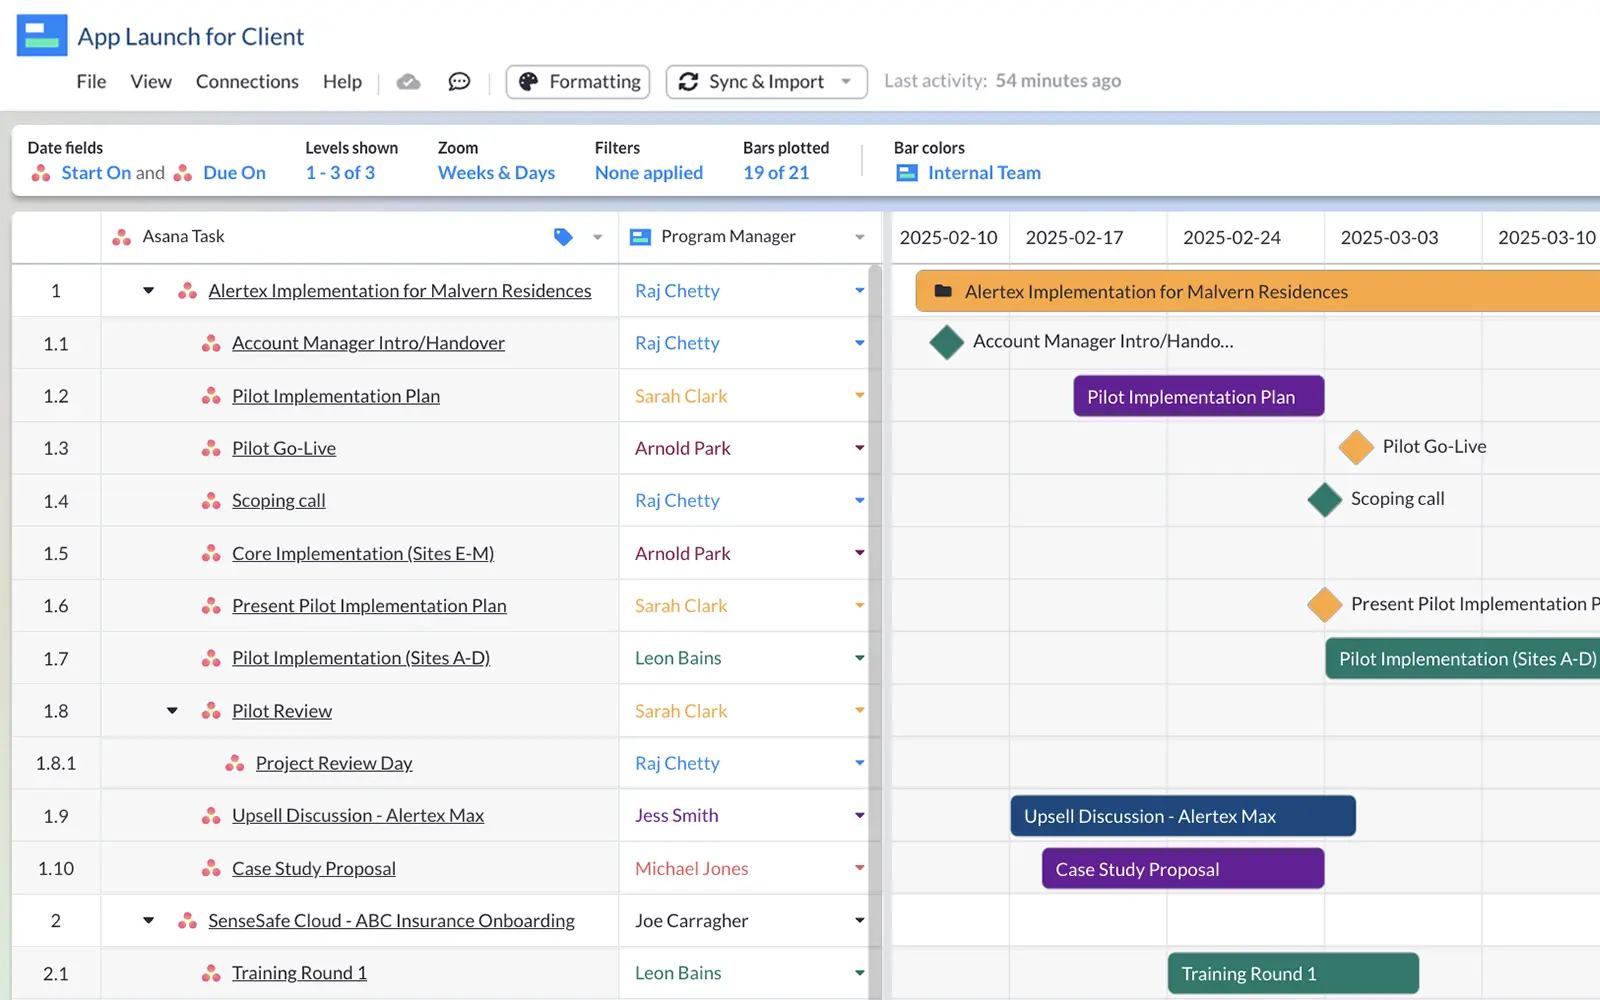
A Gantt chart in Visor using Asana data, with multiple custom columns
Portfolio Gantt Charts
Sometimes, you need a bird’s-eye view of all your projects in one place. This is true for organizations of all sizes, and in its varying forms, it comes under the umbrella of project portfolio management (or otherwise called PPM).
However, Asana’s Portfolio add-on doesn’t have a Gantt chart option.
Instead, Asana’s premium Portfolio feature has a Timeline view for project portfolios (which we covered earlier). However, Timeline is more basic than the Gantt chart option, missing critical features like inter-project dependencies and more.
In addition, Asana’s Portfolio add-on costs extra. You’ll need to pay $30.49 per month per user with Asana Portfolio add-on. And even then, you will only get access to a more limited Timeline view.
To create Gantt charts of your portfolio of Asana projects you should use Visor.
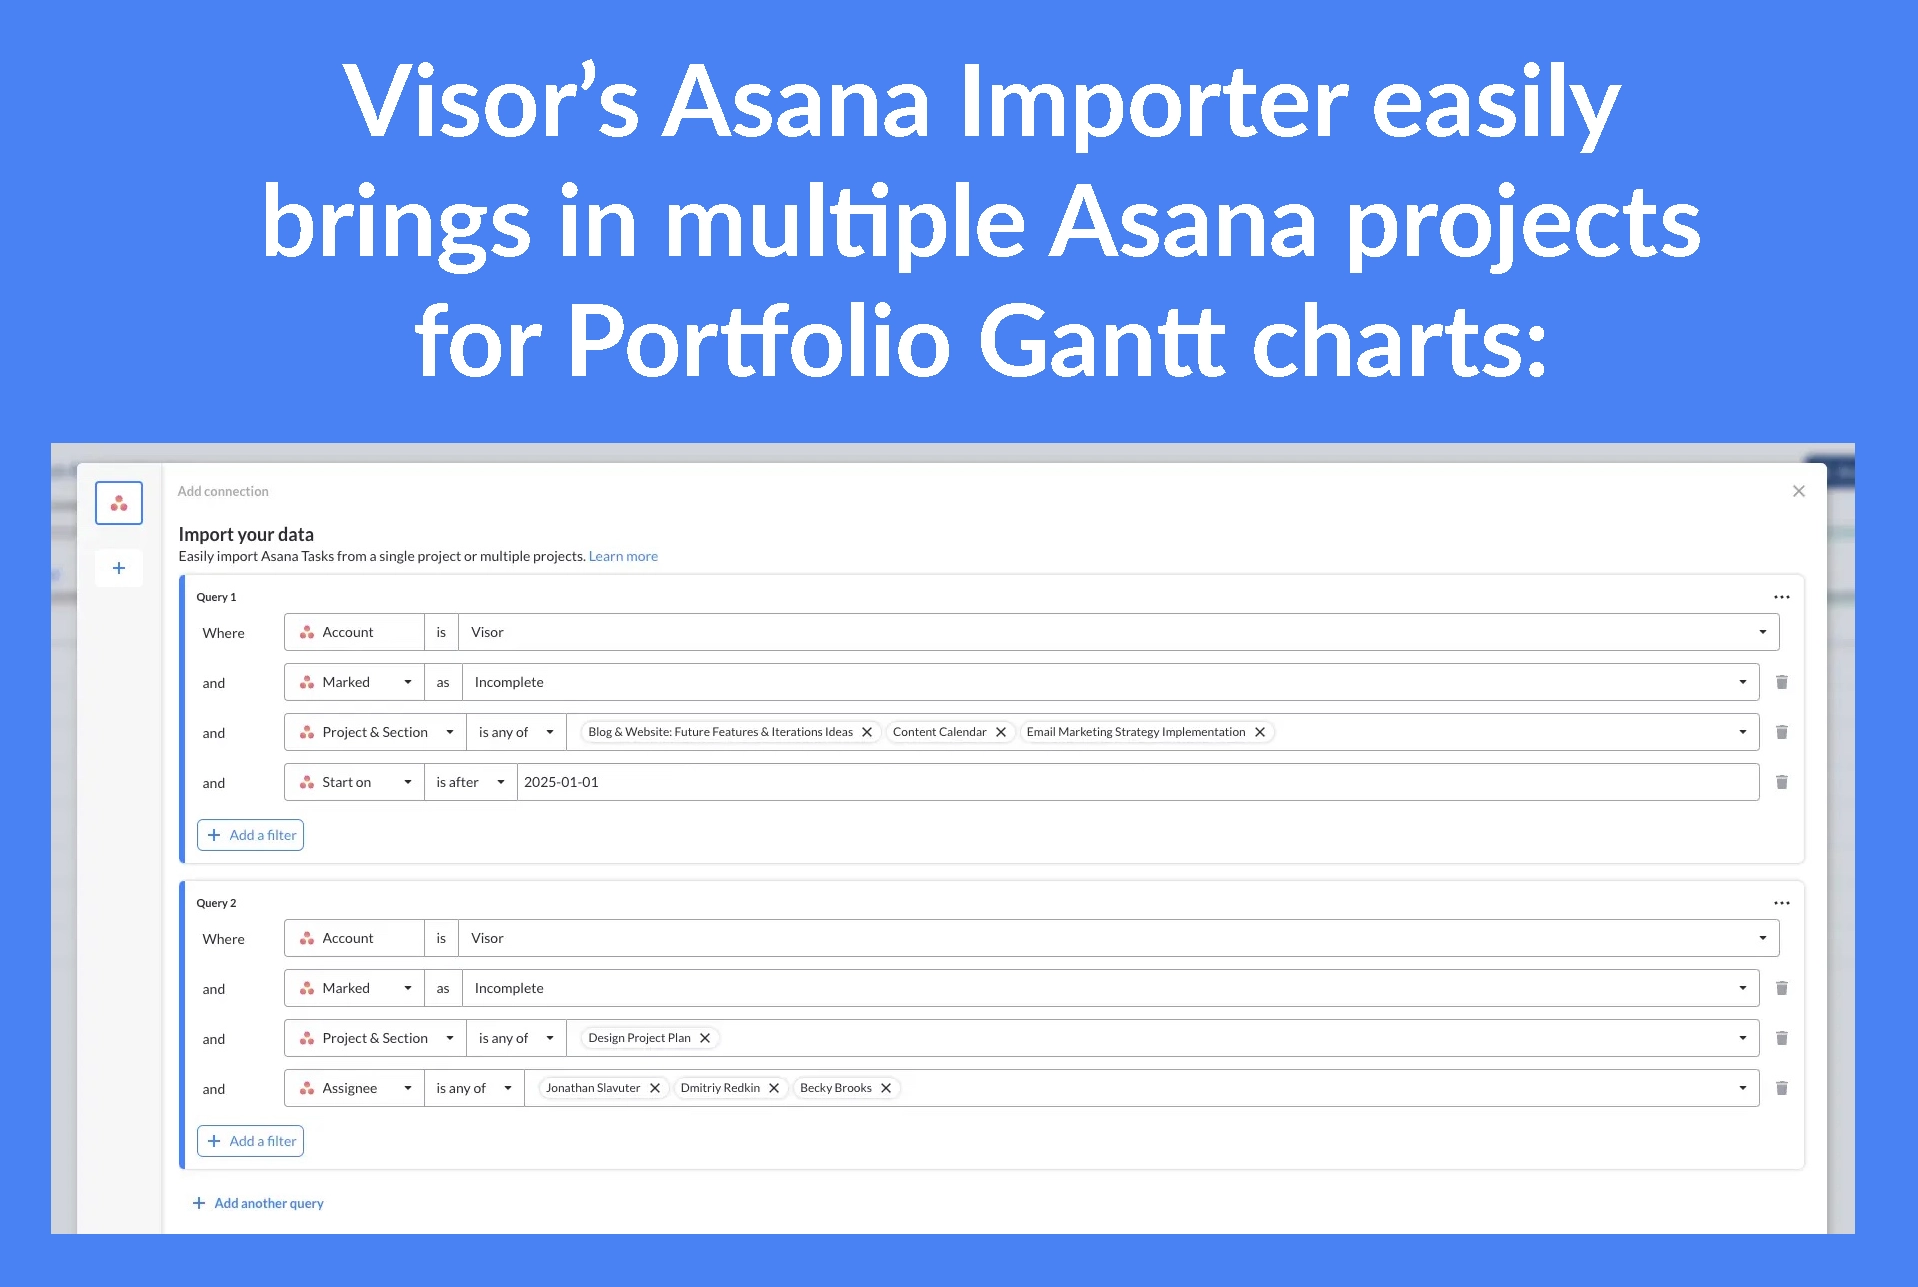
Asana has a two-way integration with Visor, so you can work with and update real-time Asana data. You can easily import multiple projects to create portfolio Gantt charts too.
You can use Visor to import multiple projects (also known as portfolios of projects), with filters to refine your data. You can visualize these portfolios on Gantt charts (and timelines, dashboards, Kanban boards, and spreadsheet views).
Importing multiple projects into Visor (with filters to refine the import) to create a portfolio roadmap
Limited Task and Subtask Granularity
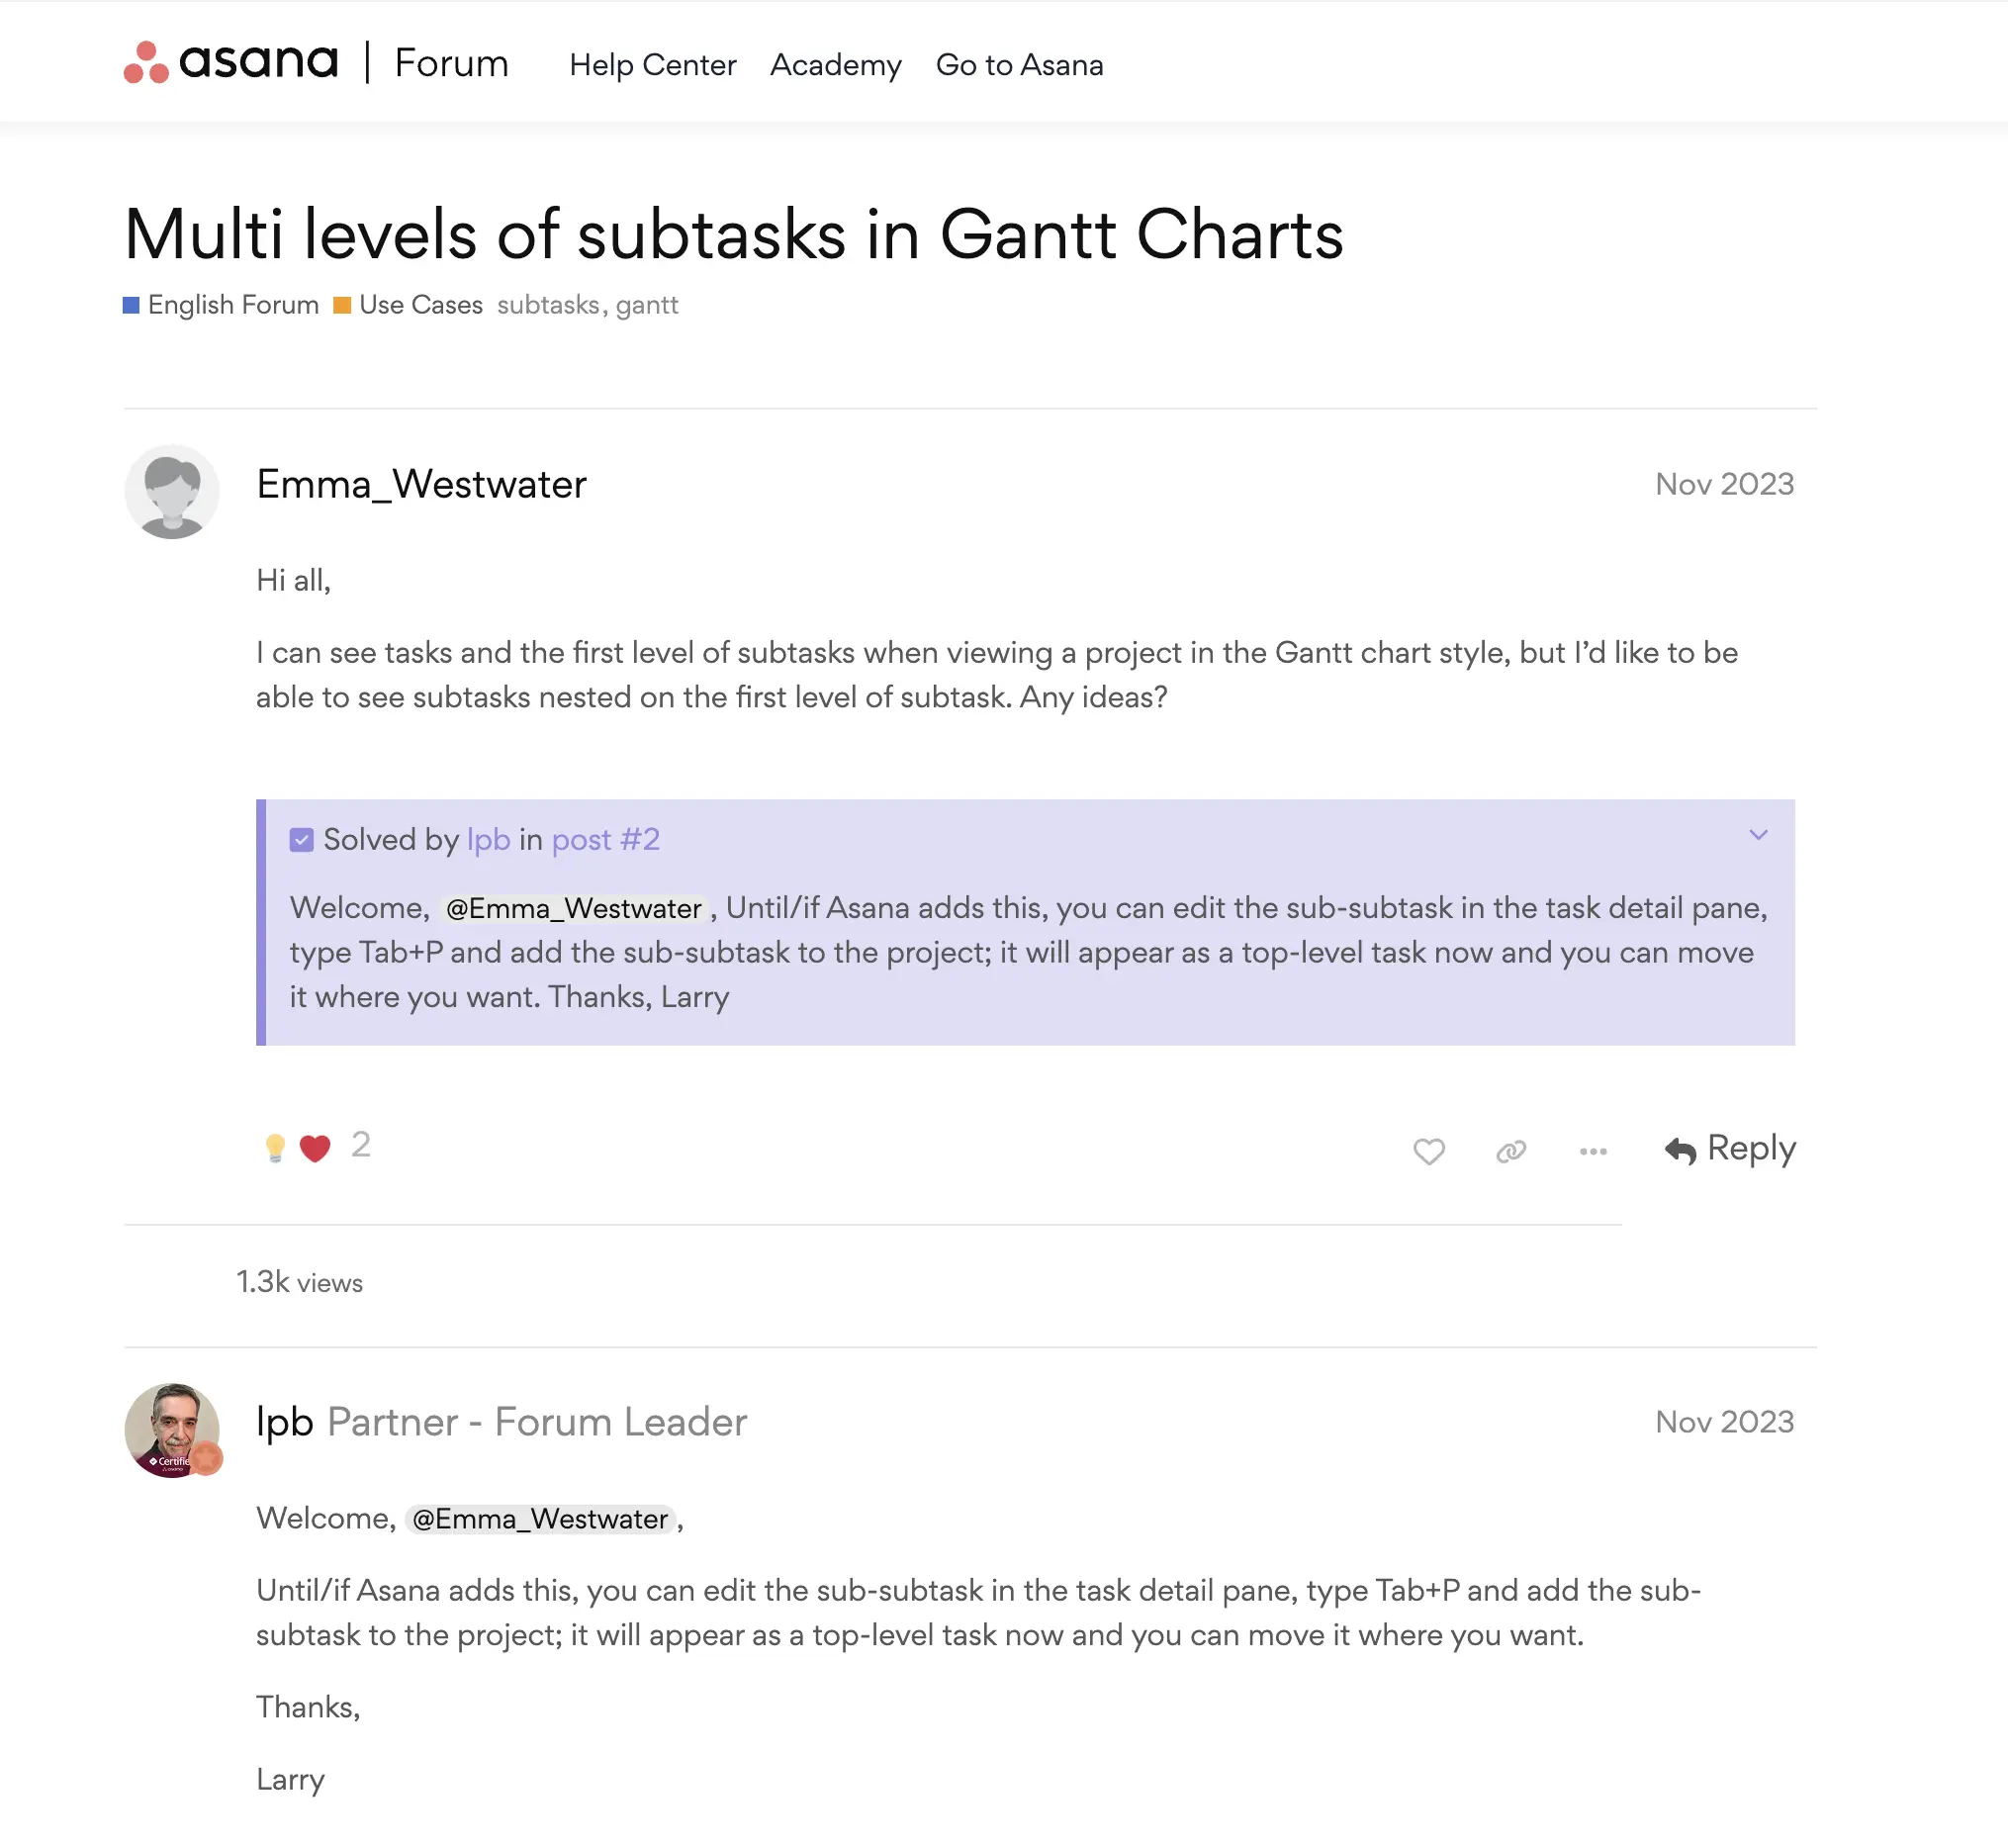
In Asana, it’s possible to add subtasks of subtasks to break work down into smaller chunks so everyone can get a precise understanding of the smaller tasks that need to be done as part of the larger tasks and subtasks in your project.
Unfortunately, you can’t see these children of parent subtasks on a Gantt chart in Asana.
You might not always need this level of detail, but this blind spot can be very frustrating when you do. If you want to find out which of these smaller tasks are incomplete, delayed, or blocking other work, you’ll have to dig around yourself in other views.
There is a workaround for this (as shown in the images below), but it’s far from ideal, and it is time-consuming to do for every child of a subtask.
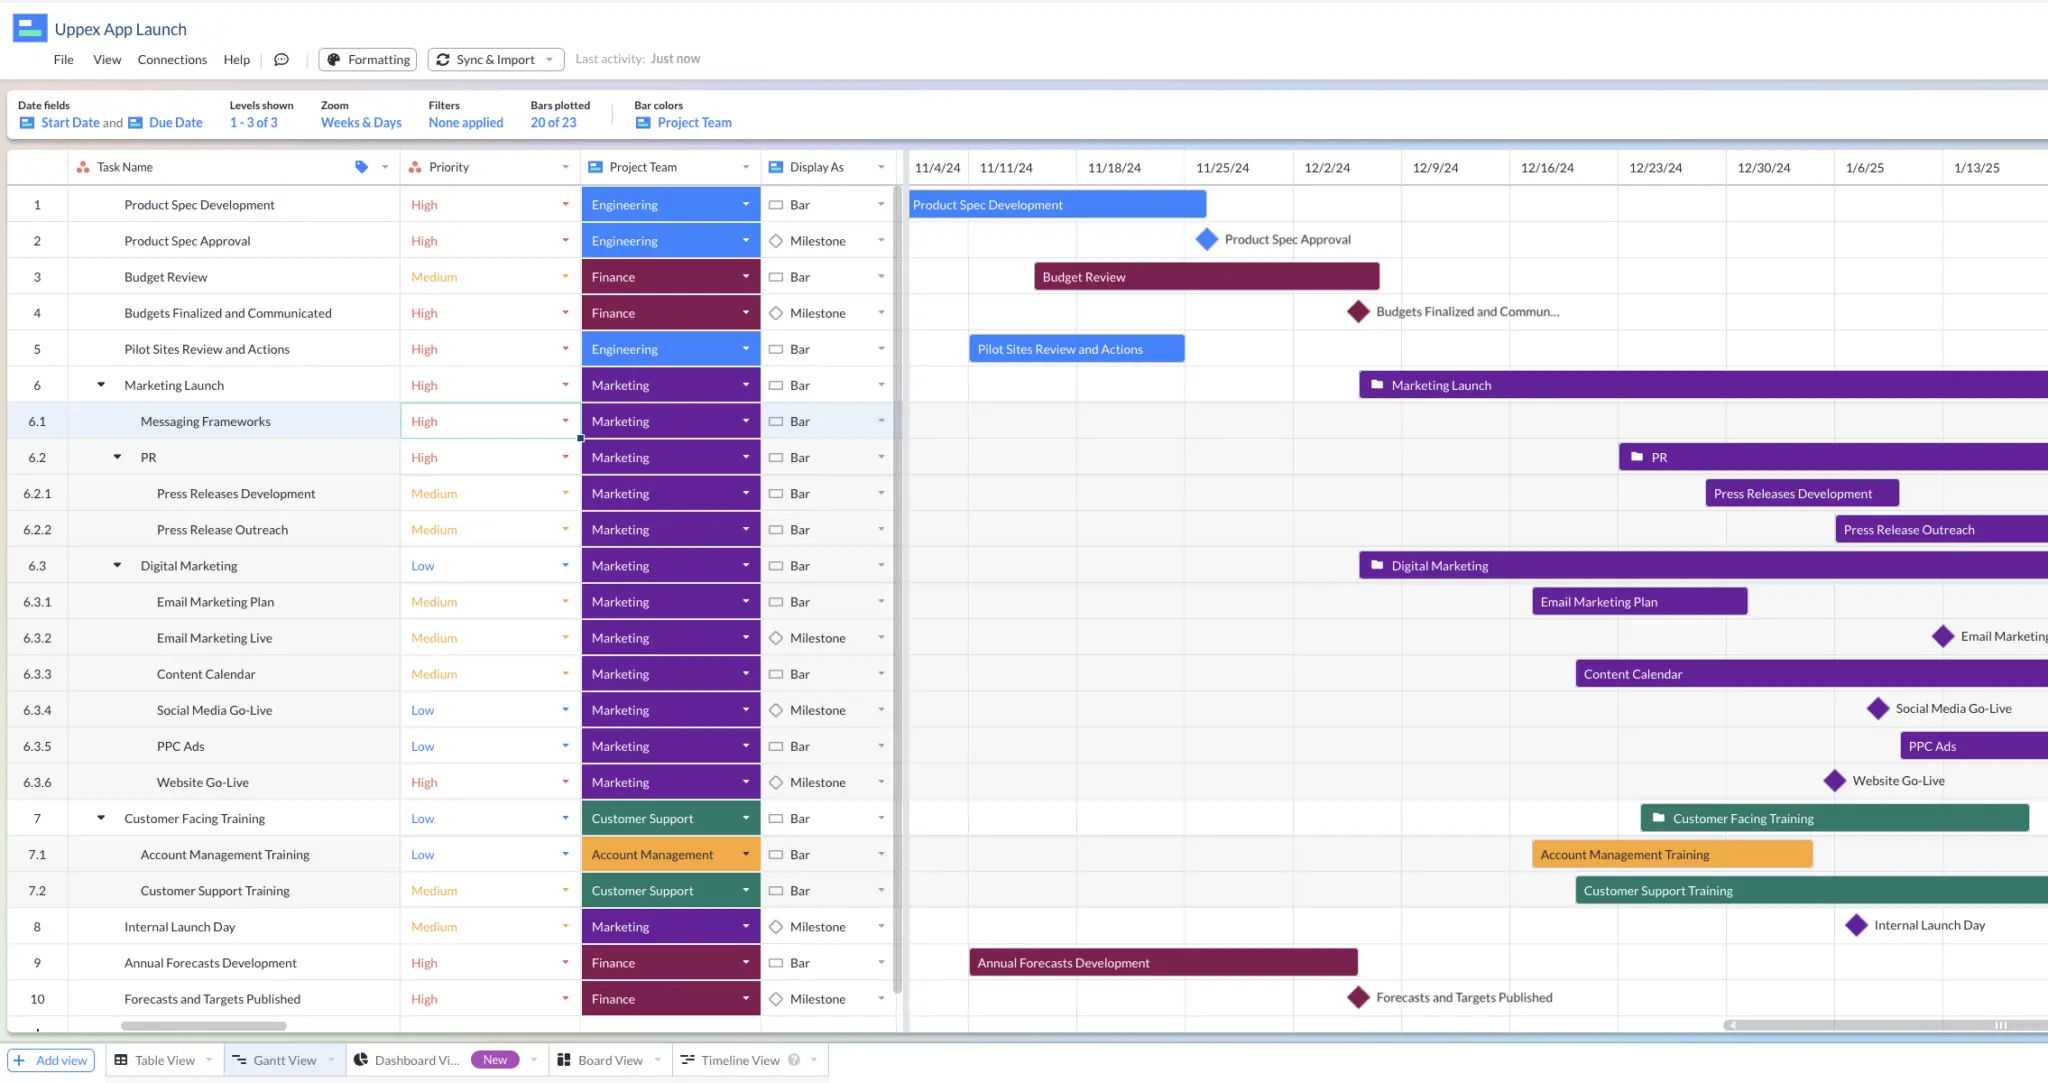
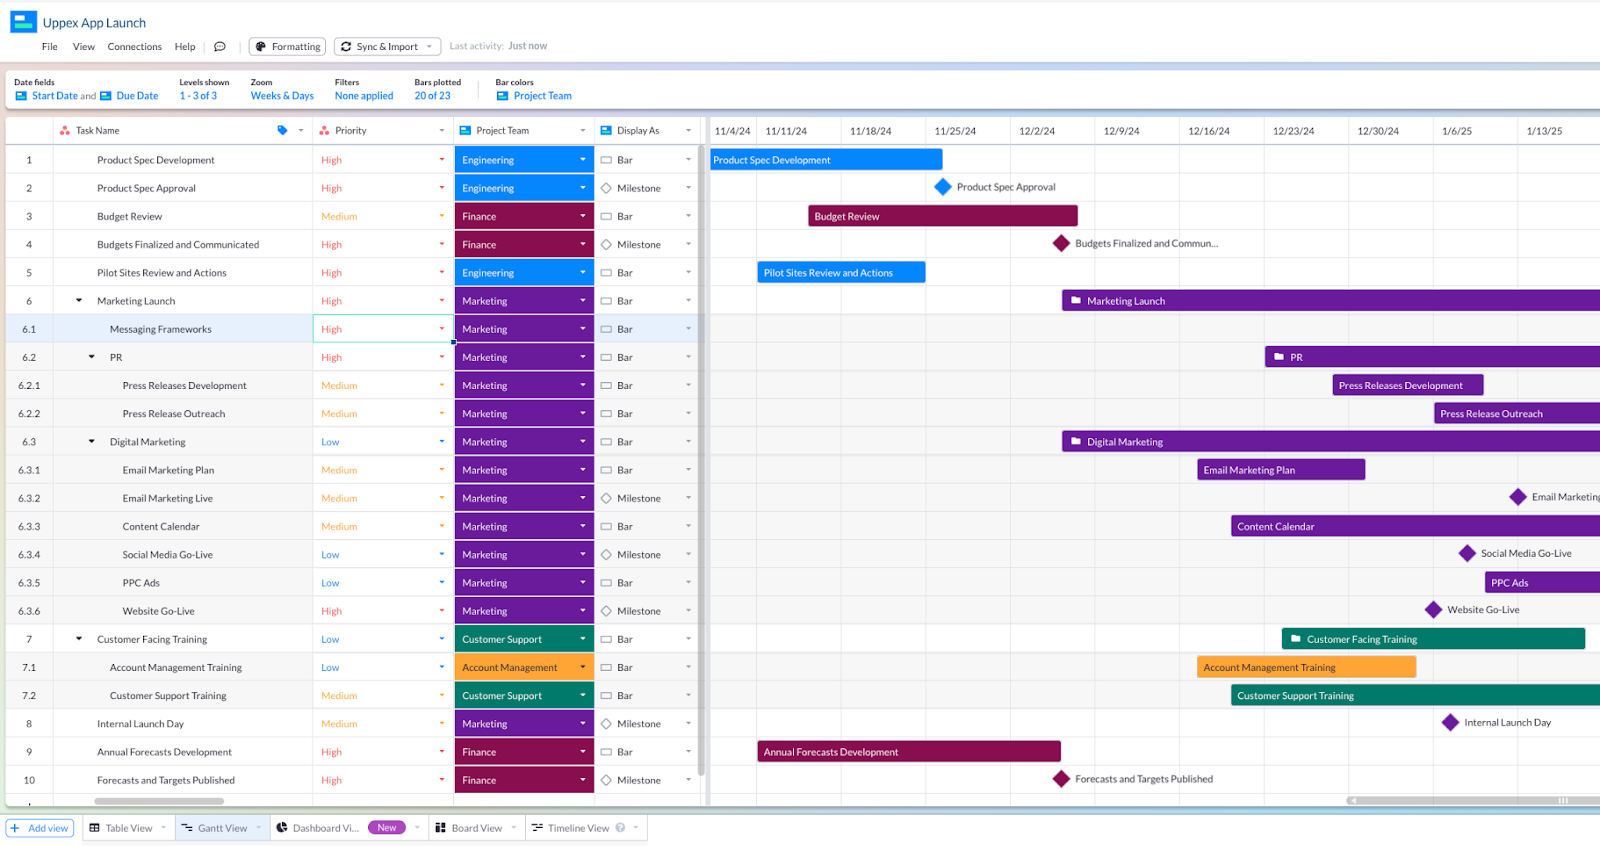
Another alternative to overcoming this Asana Gantt limitation is to use Visor. You can create Gantt charts by completely nesting tasks, subtasks, and subtasks of subtasks. You can quickly expand and collapse these to show the level of detail you need at any time.
You can also use the Gantt chart settings to adjust which task levels are included on your Gantt chart, allowing you to create high-level or detailed views for different stakeholders.
Asana Gantt Chart in Visor, showing nesting of tasks and subtasks
Calculations and “Roll ups”
Asana’s native Gantt chart view does not include “roll up” calculation functionality. This means you can’t sum up sets of data that make sense to be grouped together.
For example, common and useful roll up calculations on Gantt charts include:
- Adding up the duration of a task and its subtasks to provide a total expected duration
- Adding up the number of hours per assignee across multiple tasks or projects
- Adding up the cost of subtasks within a task, to give a total task cost
- Adding up all tasks within a project, to give a project total cost
- Calculating the overall “percentage complete” for a task based on completion of all subtasks
- Calculating the overall “percentage complete” for a project based on the completion of tasks and subtasks
- Adding up the number of allocated hours for each task and subtask on a project to give a total project duration or resource requirement
As you can see from the examples above, roll up calculations can save you enormous amounts of manual calculations, and provide you with valuable and immediate information to help you plan individual projects and portfolios of projects.
Asana does include custom calculated/formula fields, but these are only visible in Asana’s list view, and you can’t add them to your Gantt chart views. So, you would need to keep switching back and forth between your Gantt chart and List view.
How to Create an Asana Gantt Chart
To create an Asana Gantt chart you’ll need to be using the Starter plan or higher.
Step 1: In Asana, navigate to your project and click “Add tab”:
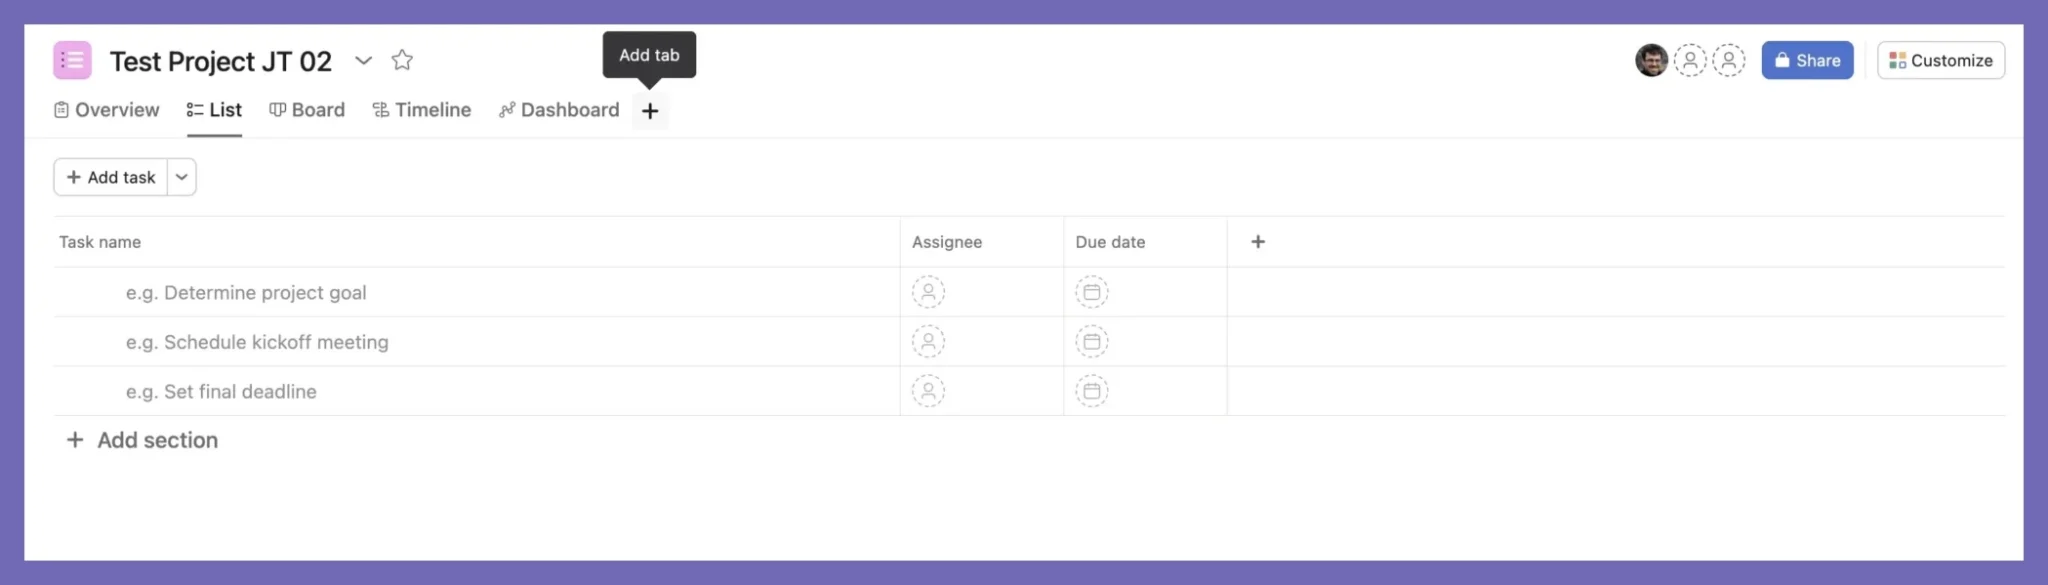
Step 2: Select “Gantt”:
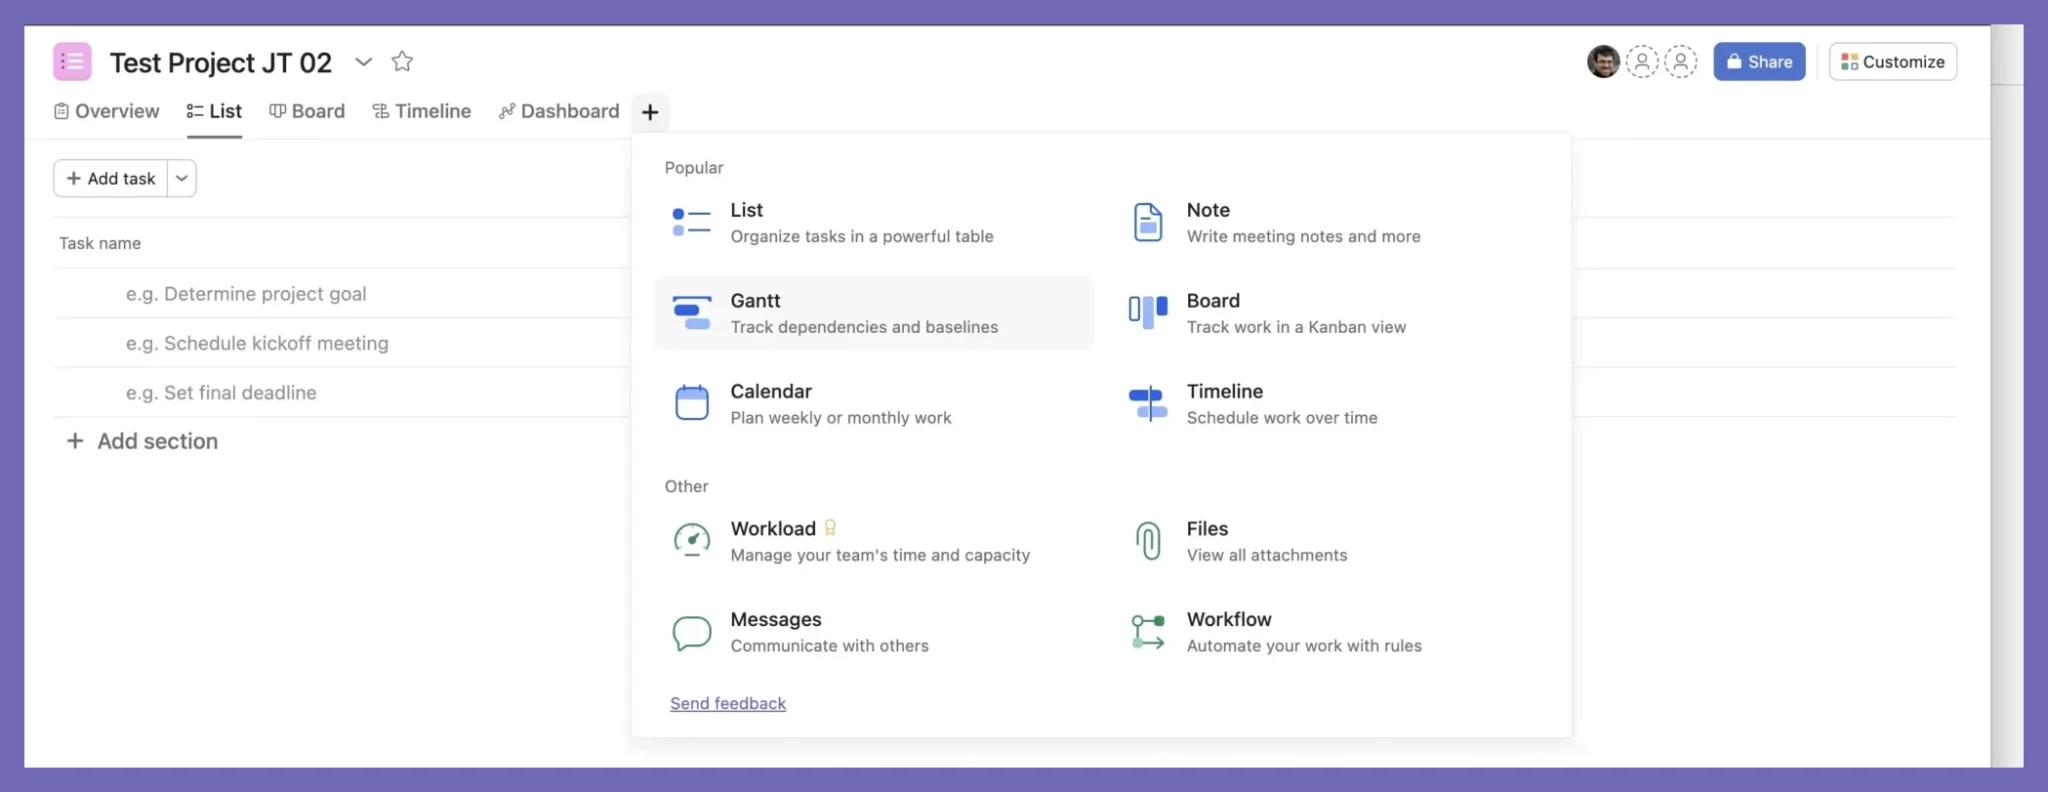
Your Gantt chart will now be automatically populated with tasks from your project, or you can add and schedule tasks directly in the Gantt chart.
Step 3: Customize
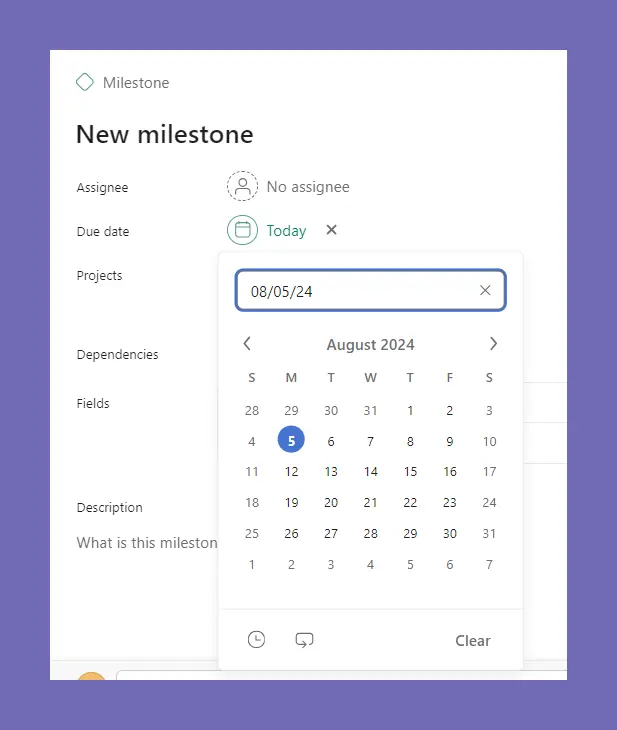
Once you have your Gantt chart in Asana, you can do things like add Milestones, dependencies, and color-code your Gantt based on things like priority status.
Example of adding a milestone to a Gantt in Asana:
Asana Gantt Integrations & Alternatives
The limitations of Asana’s native Gantt chart view (explored above in more detail) means that many people use more specialized Gantt chart apps that integrate with Asana.
It’s possible to use Asana’s Google Sheets integration to create a Gantt chart in Google Sheets, or other spreadsheet software like MicroSoft Excel.
However, as you’ll know if you’ve ever seen a Google Sheets Gantt chart they can be more trouble than they are worth, being painstaking and time-consuming to construct, with the end result being rather unimpressive and extremely flaky.
That’s why Gantt chart apps are among the most popular Asana integrations for project management. It’s important for you to know that just because an app has Gantt chart functionality, and an integration with Asana, that doesn’t mean you can use it’s an app you can use
Gantt chart apps that integrate with Asana vary in their precise functionality, strengths, and weaknesses, but here are the main things Asana users get from them that feel they can’t get from Asana Gantt charts:
- Project portfolio Gantt Charts with inter-project dependencies
- Visualization of tasks, subtasks, and subtasks of subtasks
- Roll up calculations or calculated fields on Gantt charts
- Inter-project dependencies
- Greater customization
- Ability to add, remove, and change columns on the Gantt chart
- Ease of sharing, embedding, and exporting
The Best Gantt Chart Integrations for Asana:
Visor
Visor unlocks sophisticated and attractive Gantt chart views for your Asana projects and portfolios of projects. It enables you to create beautiful, crystal clear Gantt charts and other visualizations, which you can easily share with anyone.
Visor has a powerful two-way Asana integration that keeps your data in sync and maintains your nesting of tasks, subtasks, and so on.
Creating Gantt charts for your Asana projects, programs, and portfolios in Visor unlocks a wider range of functionality and flexibility that you just don’t get with Asana’s native Gantt charts.
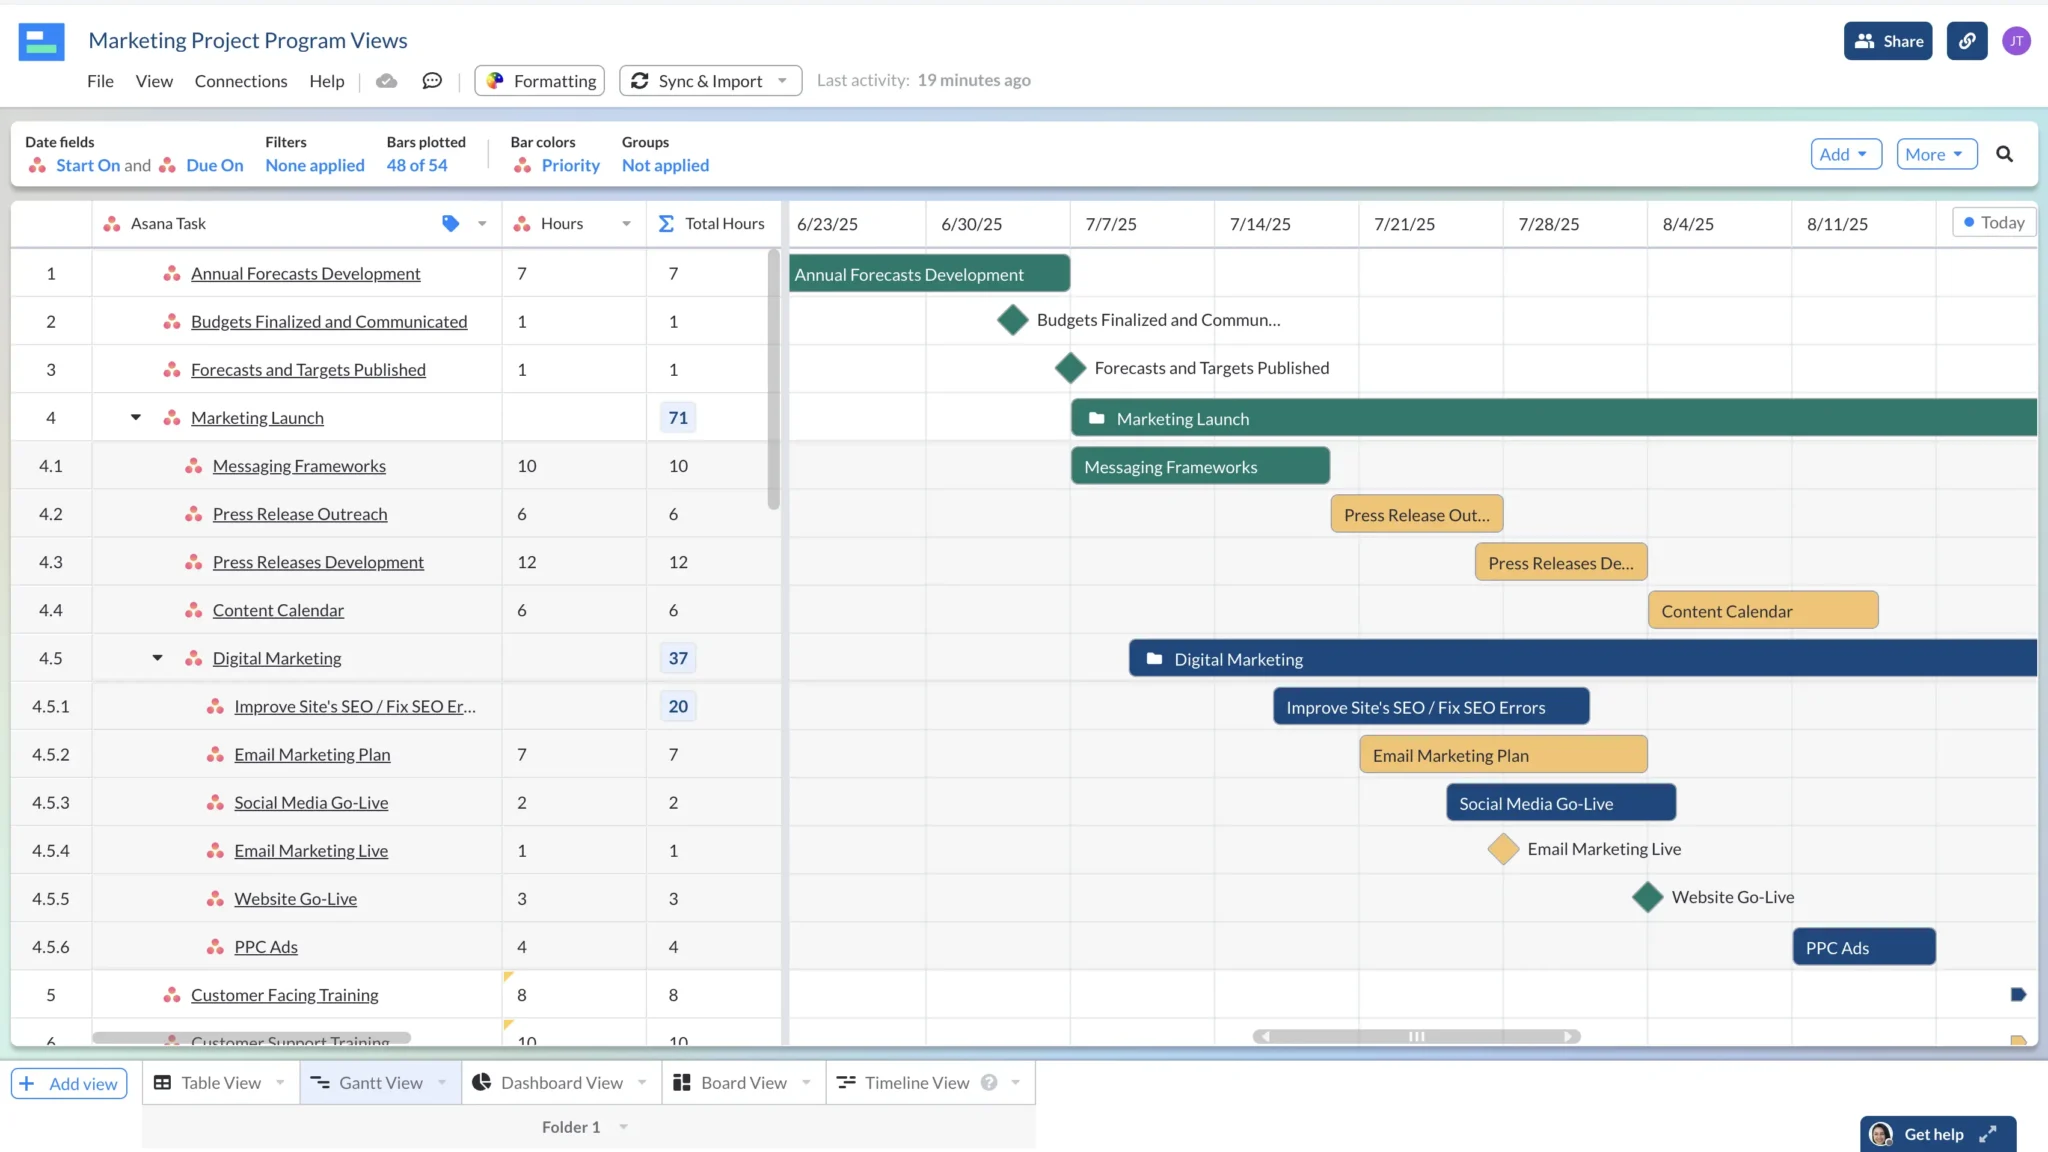
Gantt Chart in Visor with real-time Asana project data – and a rollup field for total hours allocated to each project and parent task:
The Power of Flexible Grouping
Unlike in Asana’s native Gantt charts, in Visor you can also group your Gantt chart by any dropdown field, some of the most common groupings on Gantt charts include:
- Project
- Assignee
- Team
- Priority
- Status
- Delivery Month
- Program
You can create multiple Gantt charts with different groupings for the same Asana project/group of projects. This enables you to create a range of Gantt charts that show your projects from different angles, which is so useful for:
- Keeping a wide range of stakeholders with different priorities and interests updated
- Having project-wide and team-focused views for cross-functional projects
- Empowering teams and individual team members with Gantts focused on their tasks
- Creating Gantts that focus on the highest-priority tasks for senior stakeholders
- Analyzing your projects/portfolios from a range of angles without exporting into spreadsheets or other apps
Here’s the same Gantt chart as the image above, but I’ve changed the grouping field to “Team”:
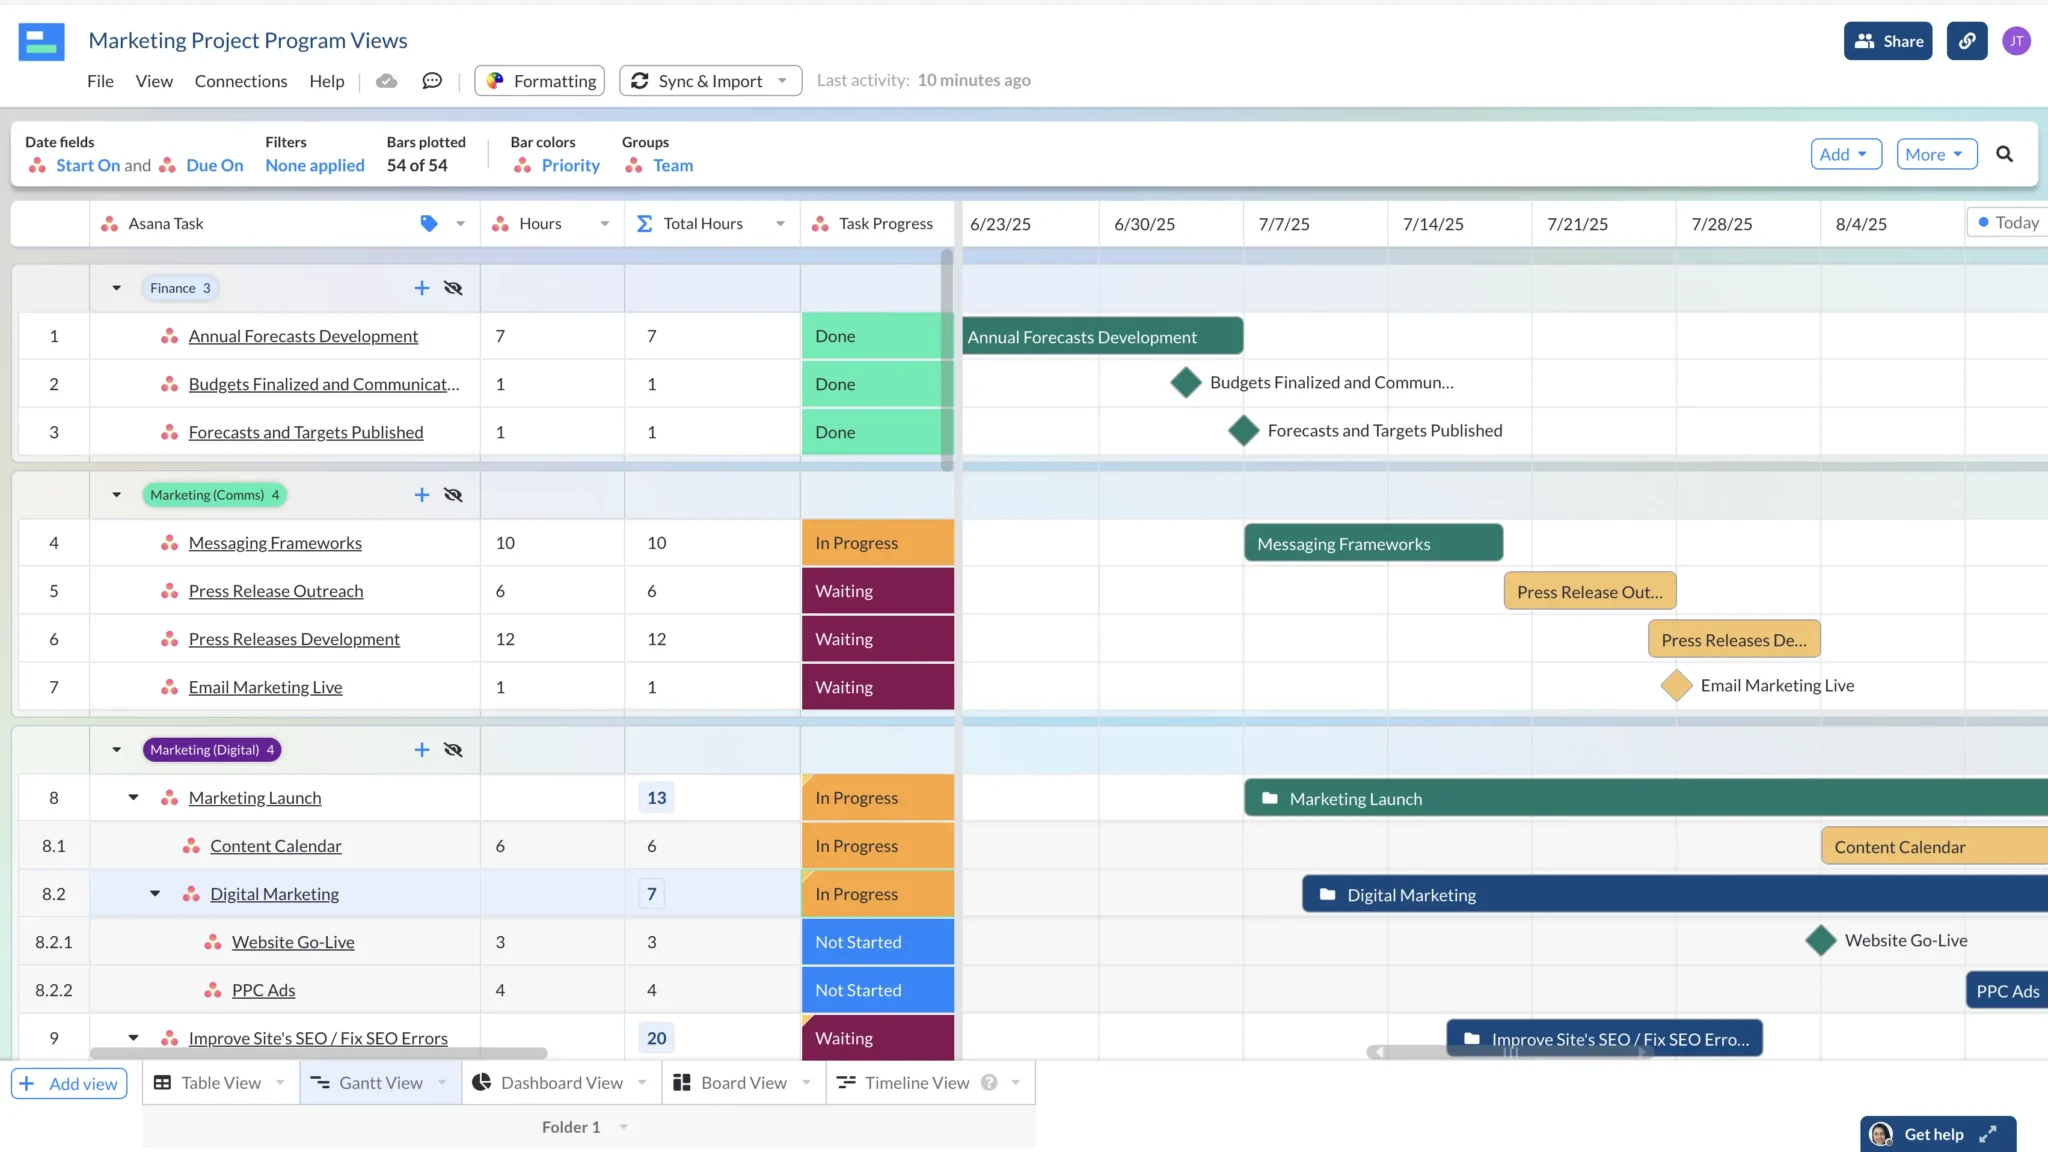
Gantt Chart in Visor Tracking Multiple Asana Projects in Real-Time:
In addition, Visor offers a ton of templates that make it easy to create Asana Gantt charts. Our Project Milestone Templates and templates for agile teams visualizing release plans all use our Gantt view and work with Asana data.
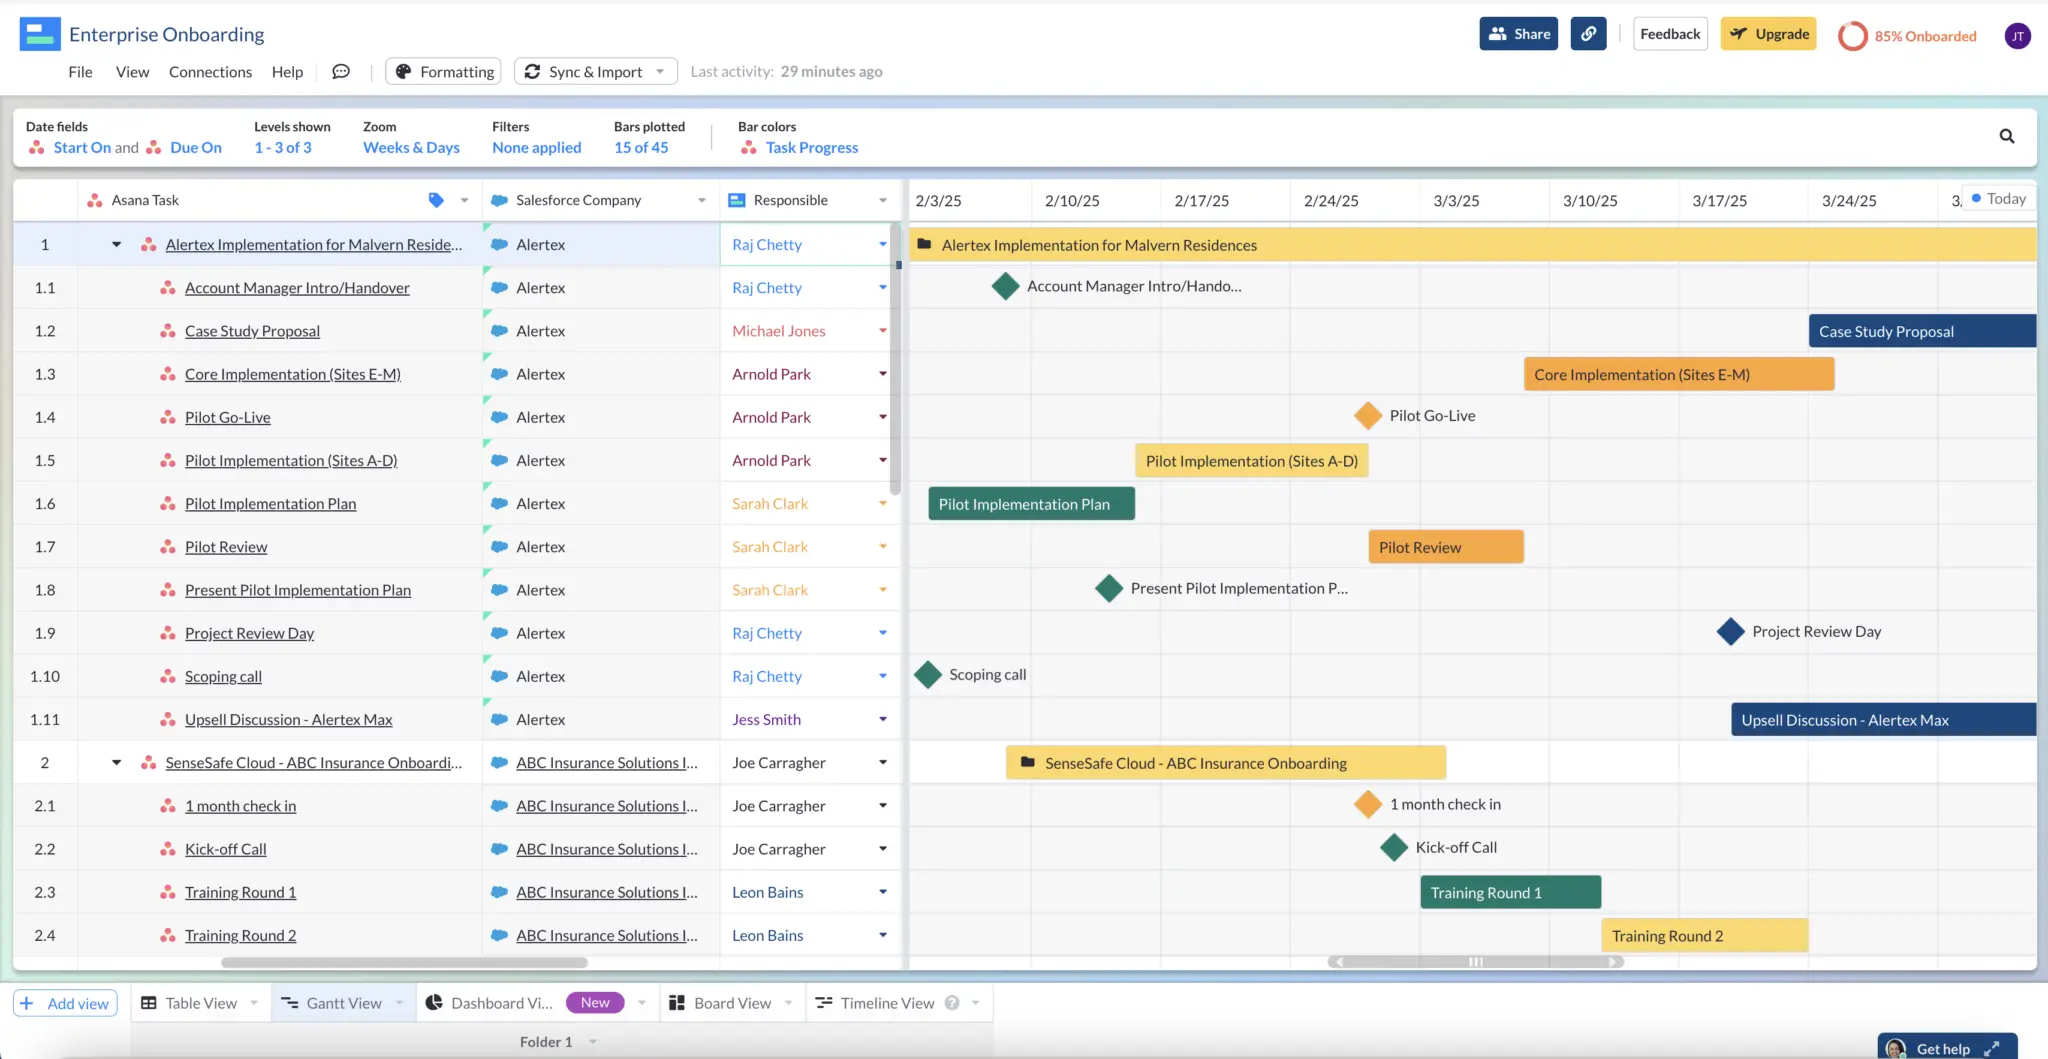
You can also combine your Asana data with data from apps like Jira and Salesforce in the same Visor Gantt chart:
With Visor, you can create portfolio Gantt charts, dashboards, list views, and a wide range of other visualizations for your Asana projects and portfolios. Try Visor for free now.
2. Instagantt
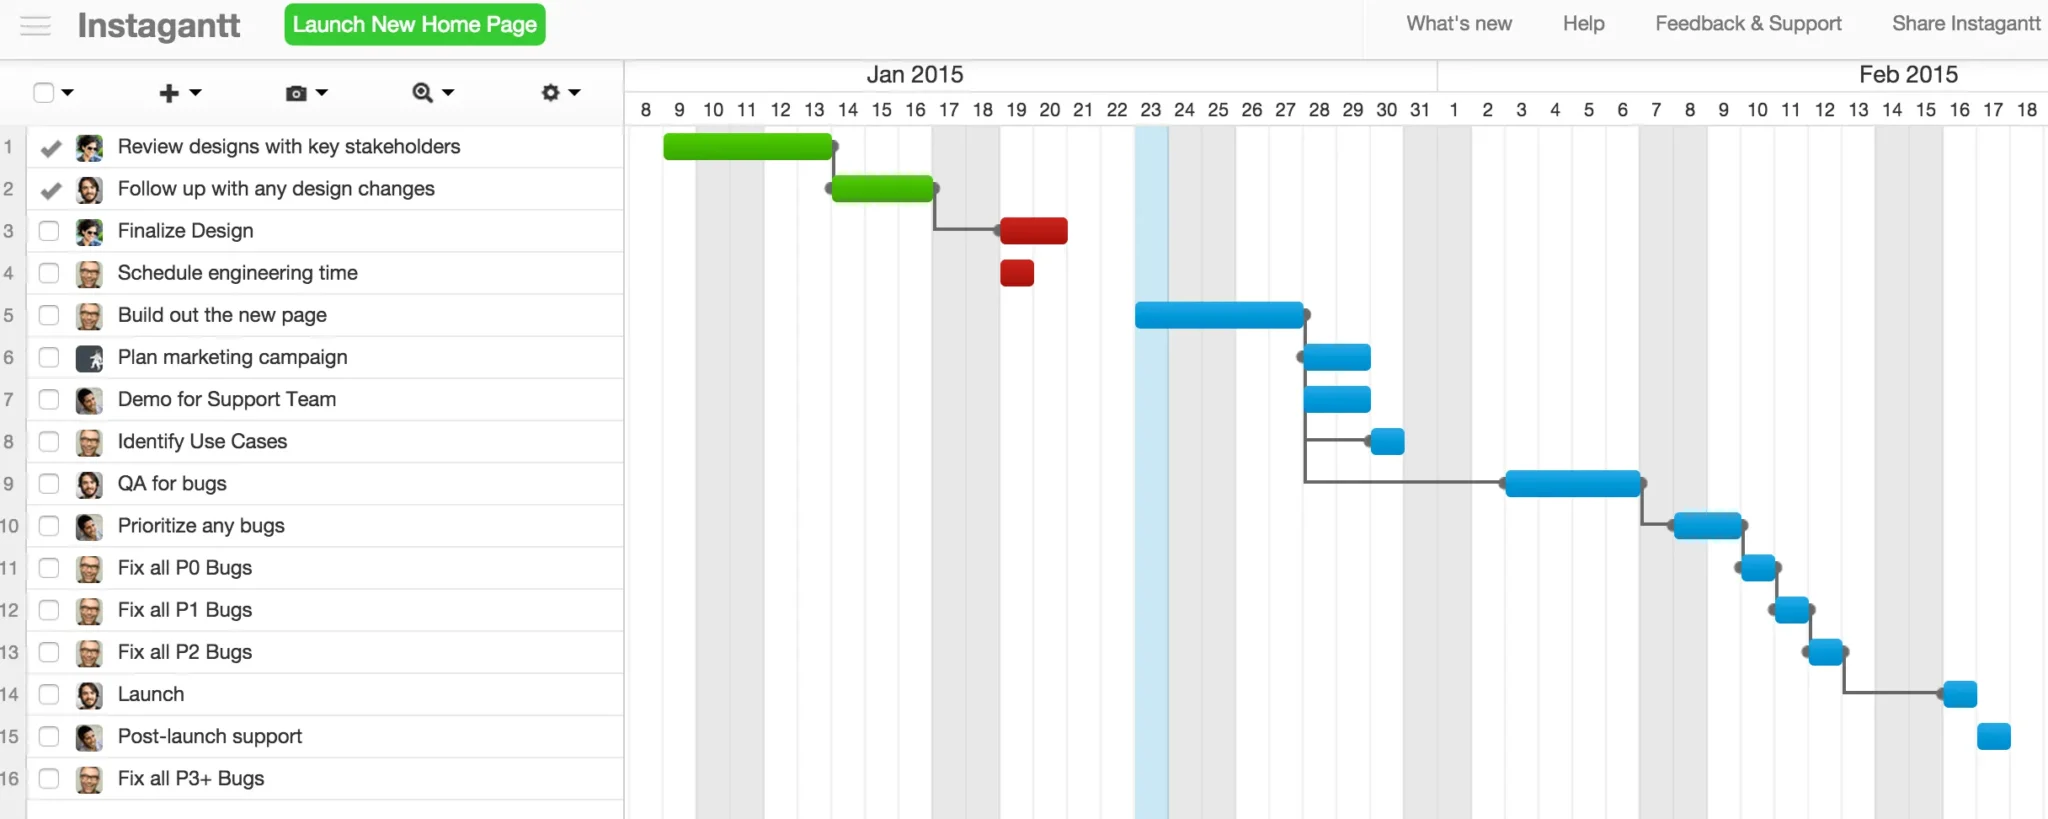
InstaGantt also has a two-way sync with Asana and adds some advanced Gantt chart functionality you can use on your Asana projects.
It includes extra features around time and cost tracking, which can give agencies and other client service organizations a more holistic approach to planning, managing, and tracking work in Gantt charts.
As you can see, InstaGantt’s Gantt charts don’t look as good as Visor’s, but they can be great for teams with a heavy focus on time-tracking, billable hours, and similar processes.
3. Smartsheet
Asana projects can be imported into Smartsheet using a third-party connector like Unito or Zapier, then you can create Gantt charts with your Asana data in Smartsheet. Smartsheet is not the best Gantt chart software you can get, and it is one of the more challenging options on this list.
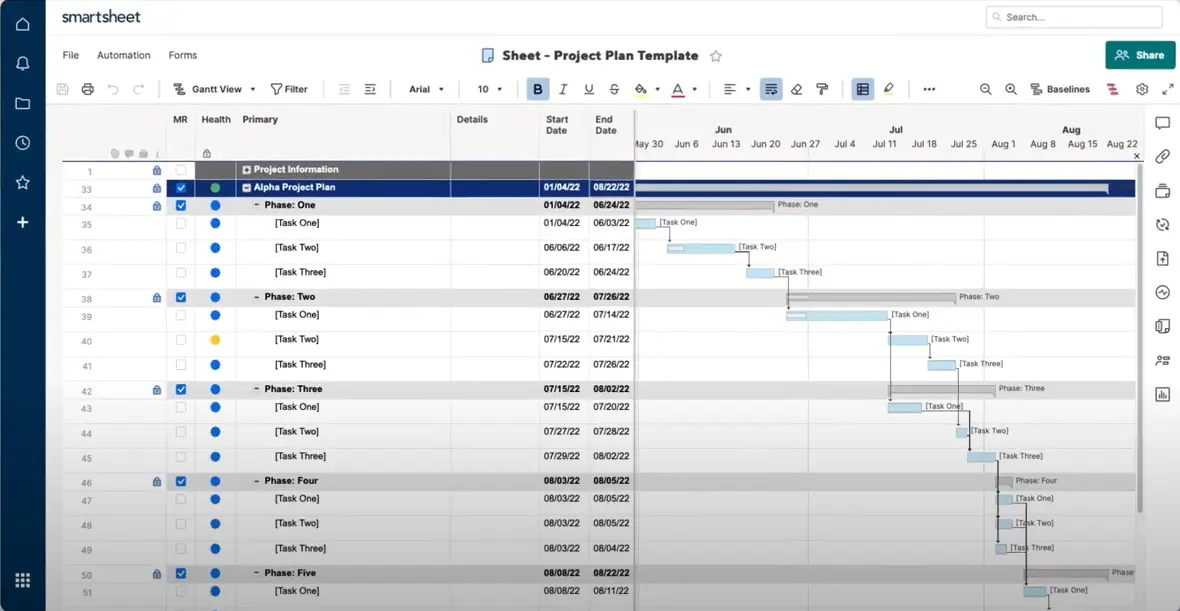
However, Smartsheet does have other powerful functionality around formulas, automation, and reporting that make it great for carrying out complex calculations on your Asana data. If that’s important to you you might want to look at using Smartsheet – or one of the many alternatives to Smartsheet – with your Asana data.
4. Microsoft Project
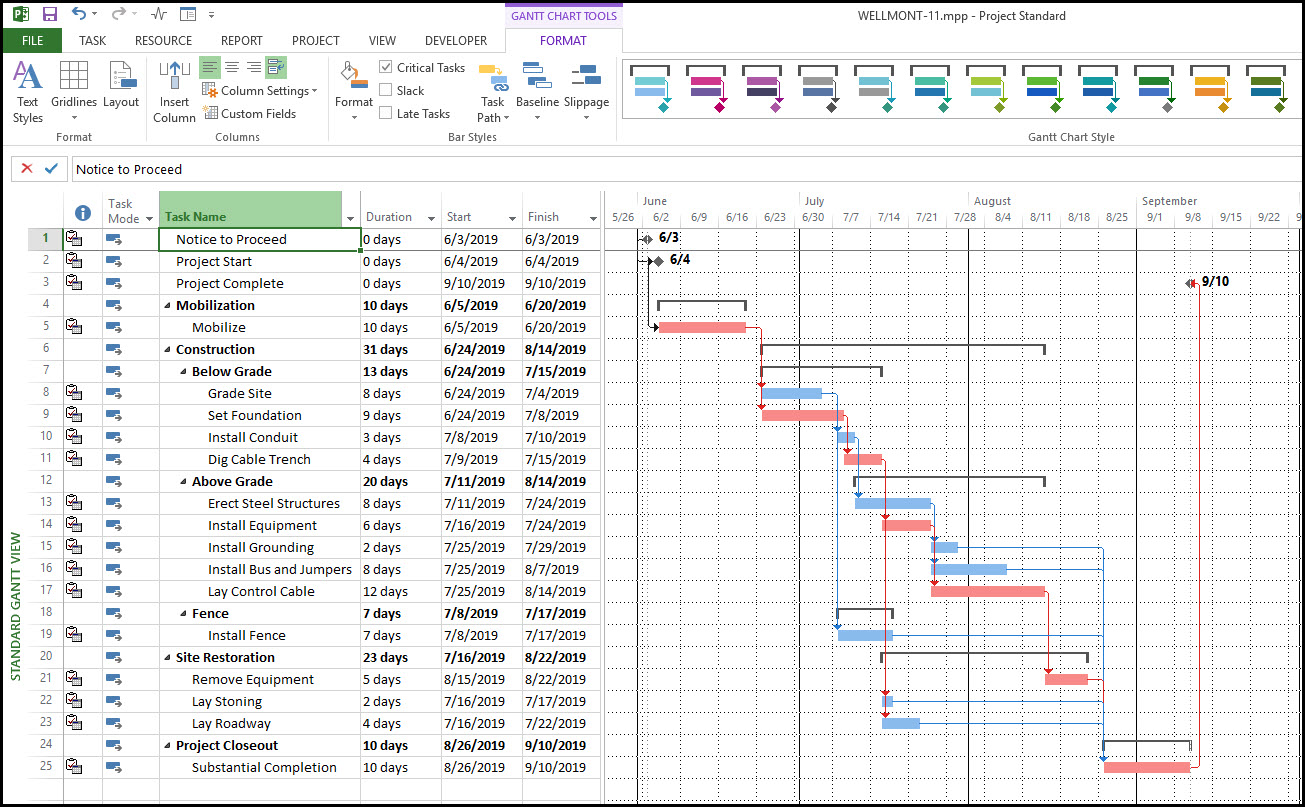
Microsoft Project: Microsoft Project doesn’t have an integration with Asana, which is a real drawback as you’ll need to export Asana data as a CSV, and then import it to MS Project. This means you will only have a snapshot of your Gantt chart which will not stay updated with changes to your projects.
However, MS Project is an extremely powerful project management system. Its Gantt charts might not look very attractive, but they are connected to a range of sophisticated tools and background processes, to help you track and analyze project performance.
An Asana integrated Gantt chart in Visor
Gantt Charts In Asana – Choosing Your Best Option
If you are paying for Asana’s Starter plan or a higher plan level, you can use Asana’s native Gantt charts.
However, as I’ve shown above, you’ll find significant limitations to the Gantt chart view in Asana itself. Some of the most important functionalities that Asana’s native Gantt charts lack are:
- Column configuration
- Portfolio Gantt charts
- Nesting of tasks below the subtask level
- Roll up calculations and other calculations
Some Asana users aren’t fans of how basic the native Gantt charts look or of the difficulties they have when trying to share them outside of the Asana app.
For these reasons and more, many Asana users add an app like Visor, to create Gantt charts that:
- Are highly customizable
- Can contain multiple projects (portfolios of projects)
- Can nest tasks below the subtask level
- Contain a range of useful roll up calculations
- Have fully custom color coding options
- Look vibrant and clear
- Are easy to share and embed in other apps
- Can also be used to create Gantt charts using Salesforce data and data from other apps
- You can mix your data from multiple apps (such as Asana, Jira, Hubspot, and Salesforce)
If you try Asana’s native Gantt chart view and find it lacks the functionality or look you want, I recommend you try Visor for free to see how much better your Asana Gantt charts can be.