

Climbing the Curve: The Platitude-free Guide to Identifying Early Signs of Product-Market Fit




Start using Visor today
- Visualize all your projects and data

- Roll up multiple projects into portfolio views
- Try Visor for FREE
In Startup Land, product-market fit (or, simply, PMF) has been described as “the only thing that matters.” So why is there so little useful guidance about how to know if you’re getting to it?
A lot of writing about PMF is so tautological that it’s basically Supreme Court Justice Potter Stewart’s famous definition of obscenity: you know it when you see it. But that doesn’t help, because by the time “you see it”, you no longer have to chase it.
Entrepreneurs need something more useful early on, like a map to see what the path towards PMF looks like and a compass to see if they are headed in the right direction. As a serial entrepreneur, former investor, and Harvard Business School graduate, I searched for years for something more useful.
One unlikely credential of mine unlocked the right door: being an amateur (but passionate) statistician. In this piece, I’ll explain how basic statistics can demystify PMF and provide valuable tools for selling a product at any stage of maturity.
What is Product-Market Fit?
Let’s review what some of the loudest voices have said so far about PMF:
Marc Andreessen famously described PMF as “the customers are buying the product just as fast as you can make it.” That sounds great, but I don’t need someone to tell me that I’ve achieved PMF when I’m overwhelmed with sales.
Andreesen’s statement is not just unhelpful, I find it actively harmful to those on the journey. When I first read this years ago, I took the implication that PMF is some magical destination that finds you, not the other way around. This definition smells like gatekeeping and fails to add any useful tools to a young entrepreneur’s toolkit. I don’t want to know what it looks like when I’m there, I want to know what it looks like along the way.
Sean Ellis, the founder of growthhackers.com claims that PMF can be assessed by understanding how disappointed your customers would be if they could no longer use your product. Rahul Vohra, the founder and CEO of Superhuman, suggests you have product-market fit if this percentage of users who would be very disappointed without your product reaches 40%. He calls it the “magic number.”
This “magic number” is slightly better, because it makes the definition less subjective. But Vohra’s method is more like a “you are here” on a map without any roads or trails. Serious entrepreneurs need something more guiding and prescriptive.
Churn is another commonly-used benchmarking tool for PMF, but that has some serious limitations, too. Firstly, retention benchmarks vary substantially based on market, industry, and target customer. Spotify’s annual retention in 2022 was 85%, but Amazon Prime’s in 2021 was 93%. It is hard to know what “good” churn is for each business (assuming you’re even in a recurring revenue business). Second, businesses can have high churn for a variety of reasons, some of which aren’t an indication that they’re failing to meet their customers’ needs.
Churn can also vary due to reasons beyond PMF. At Visor, our churn metrics have varied noticeably based on the source of our leads; customers we acquired organically have incredibly strong retention, but those acquired via more transactional means (like ads) tend to churn at a higher rate. Sometimes, churn tells us more about which portion of users came from which source than it does about the health of our business. Therefore, churn feels even less satisfying as a PMF indicator.
Most frustratingly, all these PMF indicators are just snapshots of a point in time. They don’t answer the questions early-stage entrepreneurs ask themselves almost daily: Am I progressing towards PMF? More specifically, what would I expect to see if I was getting hotter (vs. colder)?
Creating a New Entrepreneurial Tool
When I didn’t see a satisfactory solution, I started thinking about making something I could use. (Meta-entrepreneurship, anyone?). This isn’t the first time that I invented some kind of mathematical tool to solve a problem. At Insight Partners, I invented a system for describing customer concentration. And I also created the “Universal SaaS Benchmarking” spreadsheet, which ingested customer data and instantly summarized 37 different metrics about a business.
After months of noodling, the solution to this PMF question came to me when I was in Las Vegas for the Atlassian Team ‘23 conference. One morning before the conference, I looked out the hotel window at the jagged mountains standing on the horizon.
I thought to myself: building a company sometimes feels like trying to climb to the top of a mountain while blindfolded in the surrounding desert. How do you know if you’re headed in the direction of the peak? Knowing the topography as you approach the mountain would be a big help. That way, as you’re walking, you could feel whether you’re on the right path based on the terrain.
After a few more sips of hotel room coffee, I realized that the entrepreneurial curve might have a predictable shape after all. The key was remembering a profound theorem in statistics: the Central Limit Theorem.
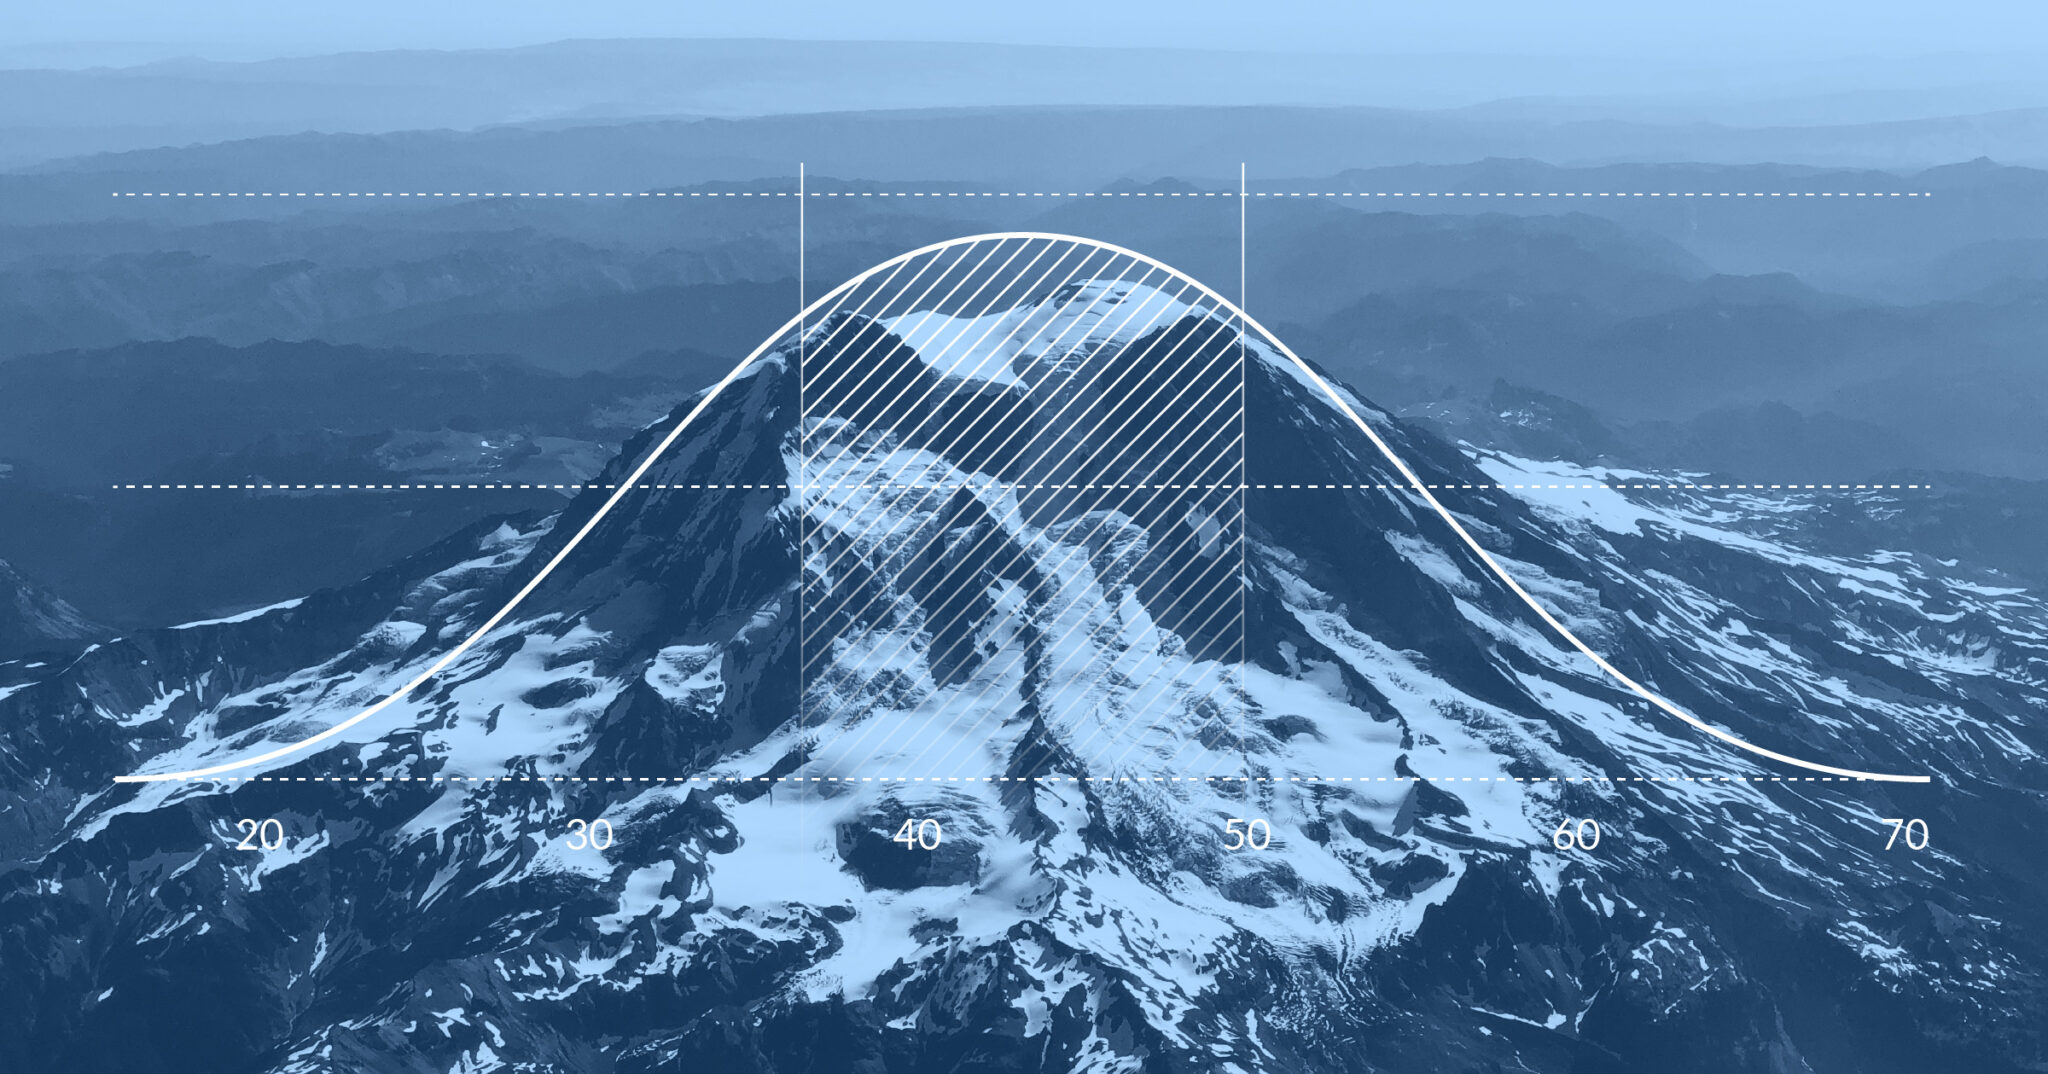
Using the Central Limit Theorem to Model People’s Preferences
Let’s bring it back to a simple business example. Imagine I’m opening a new juice bar in Manhattan. People generally fall into one of two categories:
- Juice lovers in New York: Whether influencers, fitness gurus, or health-conscious people, juice lovers make up my pool of potential customers. In business parlance, this is what we call the Serviceable Addressable Market (or SAM).
- Juice haters and non-New Yorkers: Some people will never be in a market I’m serving, and that’s okay. Not everyone likes juice, not everyone lives in New York, and for the sake of this model, we don’t have to focus on trying to serve them. An important part of defining product-market fit is being intentional about whom you are looking to serve.
Many of the New York juice lovers who stop by my store will have a variety of unique needs. Nonetheless, while each visitor’s needs may vary, we may be able to draw some conclusions about the needs of our visitors in aggregate over a larger time frame, such as a day or week.
The Central Limit Theorem lets us assume that the distribution of the average of a large number of independent, identically-distributed random variables starts to look like a normal distribution (or bell curve). In other words, if we can assume that the people considering a purchase from my business arrive randomly, then we can also assume that these customers’ needs are distributed like a bell curve.
There are a few very easy-to-please customers on the far left. There are a few very hard-to-please customers on the far right. And most customers fall somewhere in the middle.
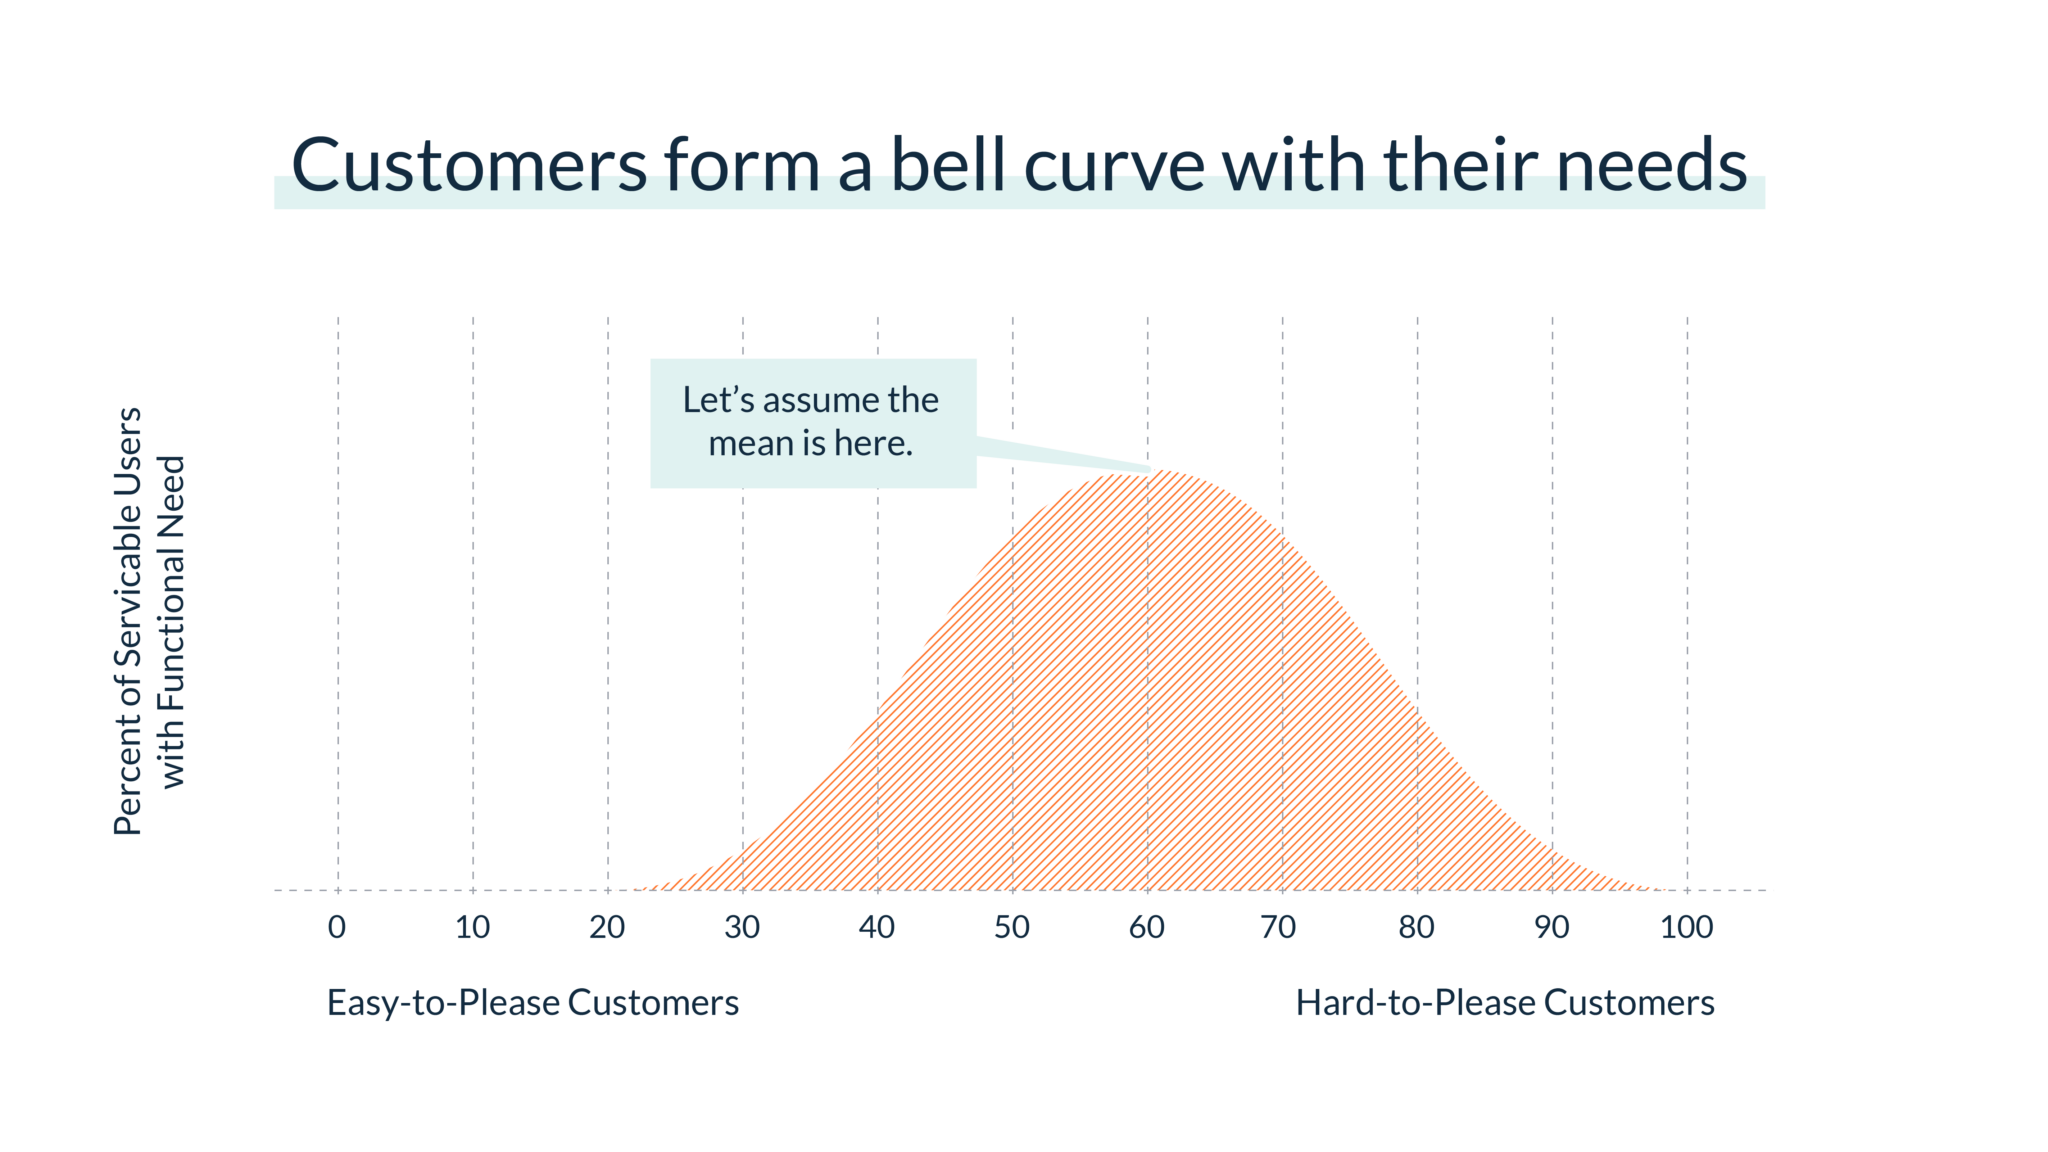
In statistical terms, this graph is called a probability density function (aka a PDF, but not the Adobe-kind). It shows the probability of customers existing at any point along the axis of customer needs.
Understanding The Curve
Imagine we’ve just opened our juice bar, but we don’t have any cups yet, and we just have oranges. We can only serve customers who want orange juice and bring their own container – a very small crowd. In other words, the maturity of this business is way on the left side of the curve, where there’s a very, very low probability of customers existing.
But as we mature the business – getting cups, more ingredients, and improving our products – we move our business to the right of the bell curve. This means we get the opportunity to win more customers whose needs fall to the left of our current position.
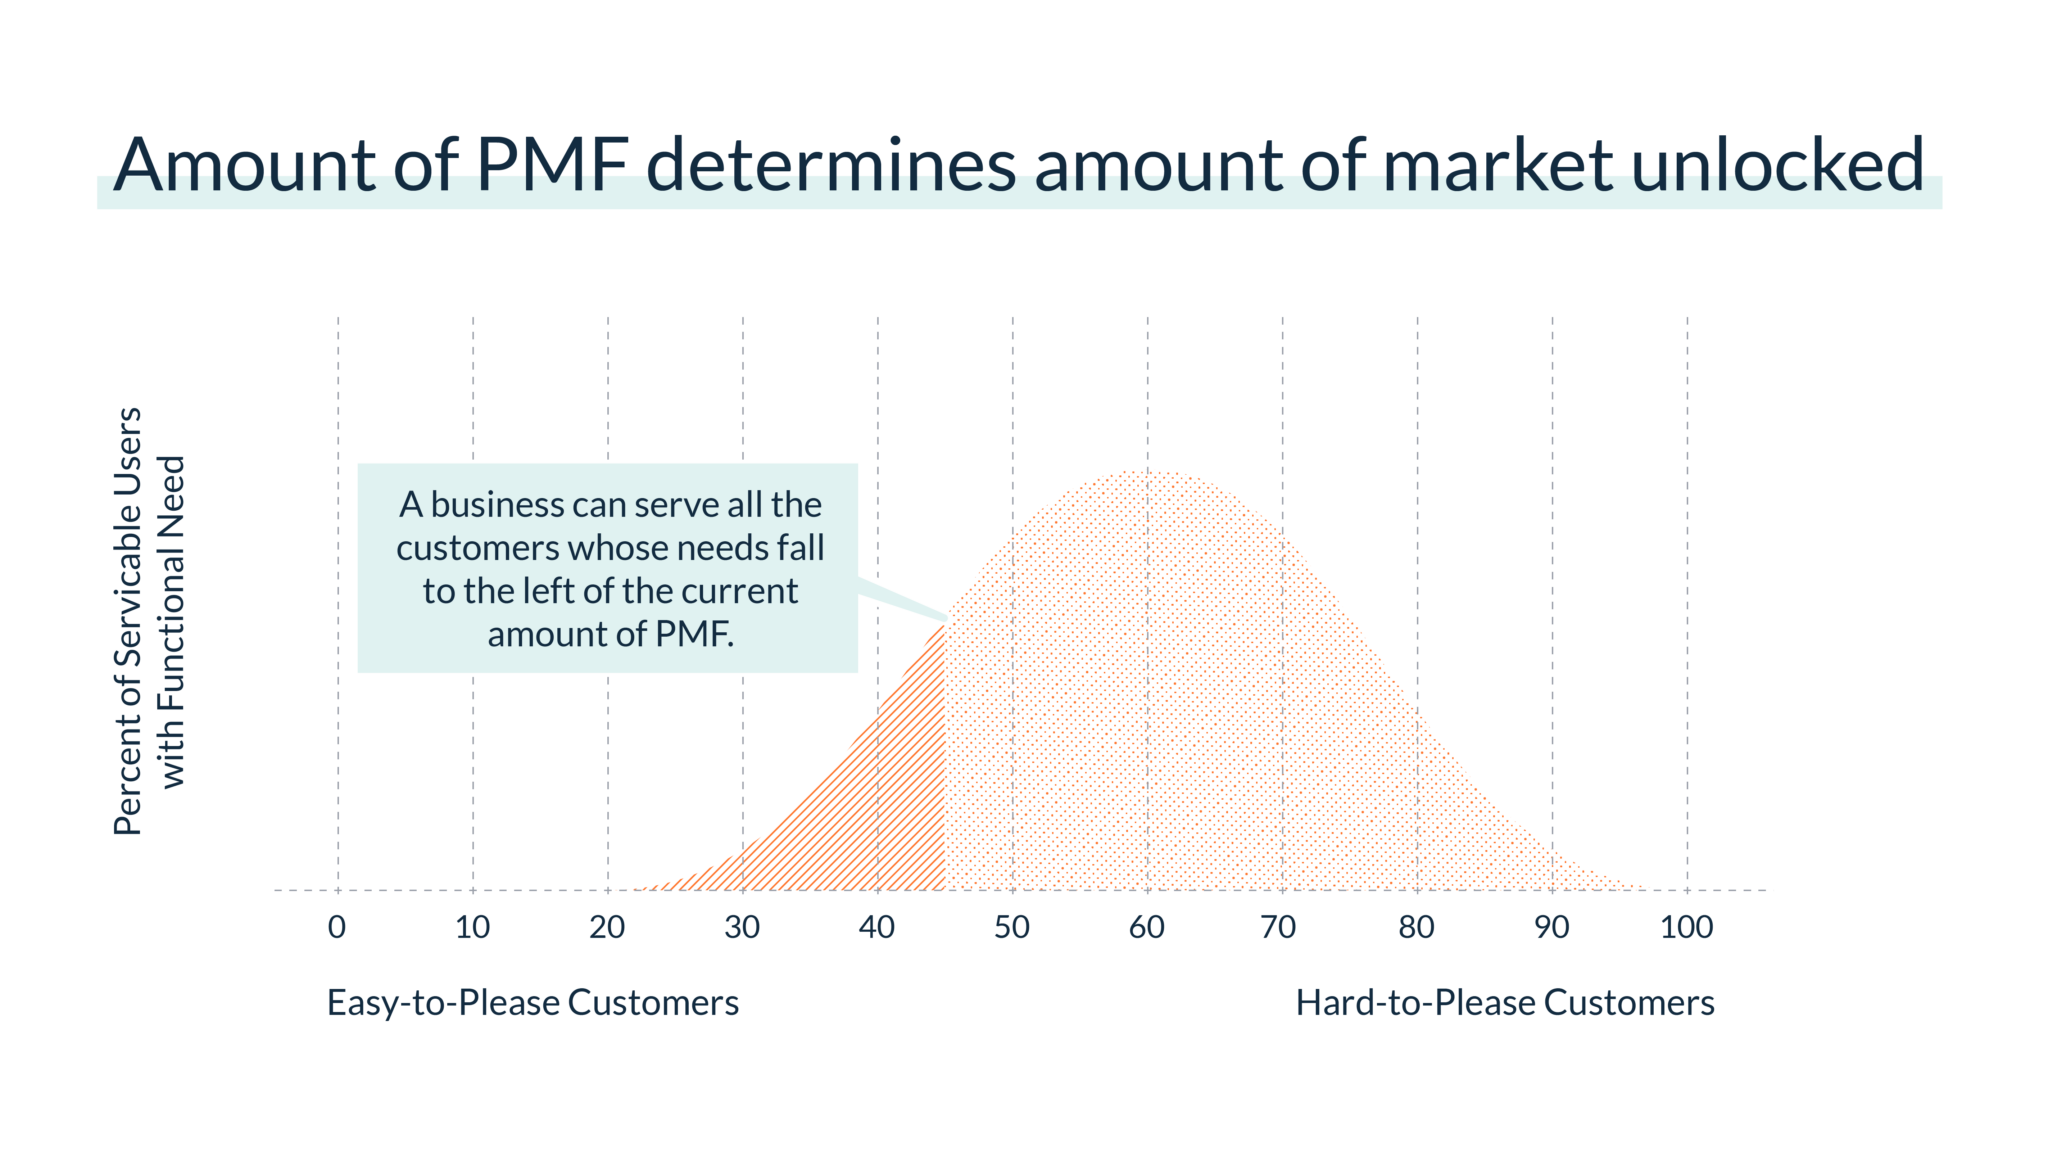
Question: What if we wanted to understand the probability that a random customer considering our product will have their needs met by it?
This model simplifies that to a simple high school statistics problem.
Answer: You can figure out the probability that your product will meet a random customer’s needs like this: Just add up all the slices of probability to the left of our current position on the bell curve. (This, by the way, is called our Serviceable Obtainable Market, or SOM).
This gives you something called a cumulative distribution function (or CDF). And when you do this for a bell curve, the shape of your cumulative distribution function becomes an S-shaped curve that starts out virtually flat, eventually becomes steeper, and then starts to flatten out again at the top. The shape of this curve is approximately the logistic curve which frequently appears in nature.
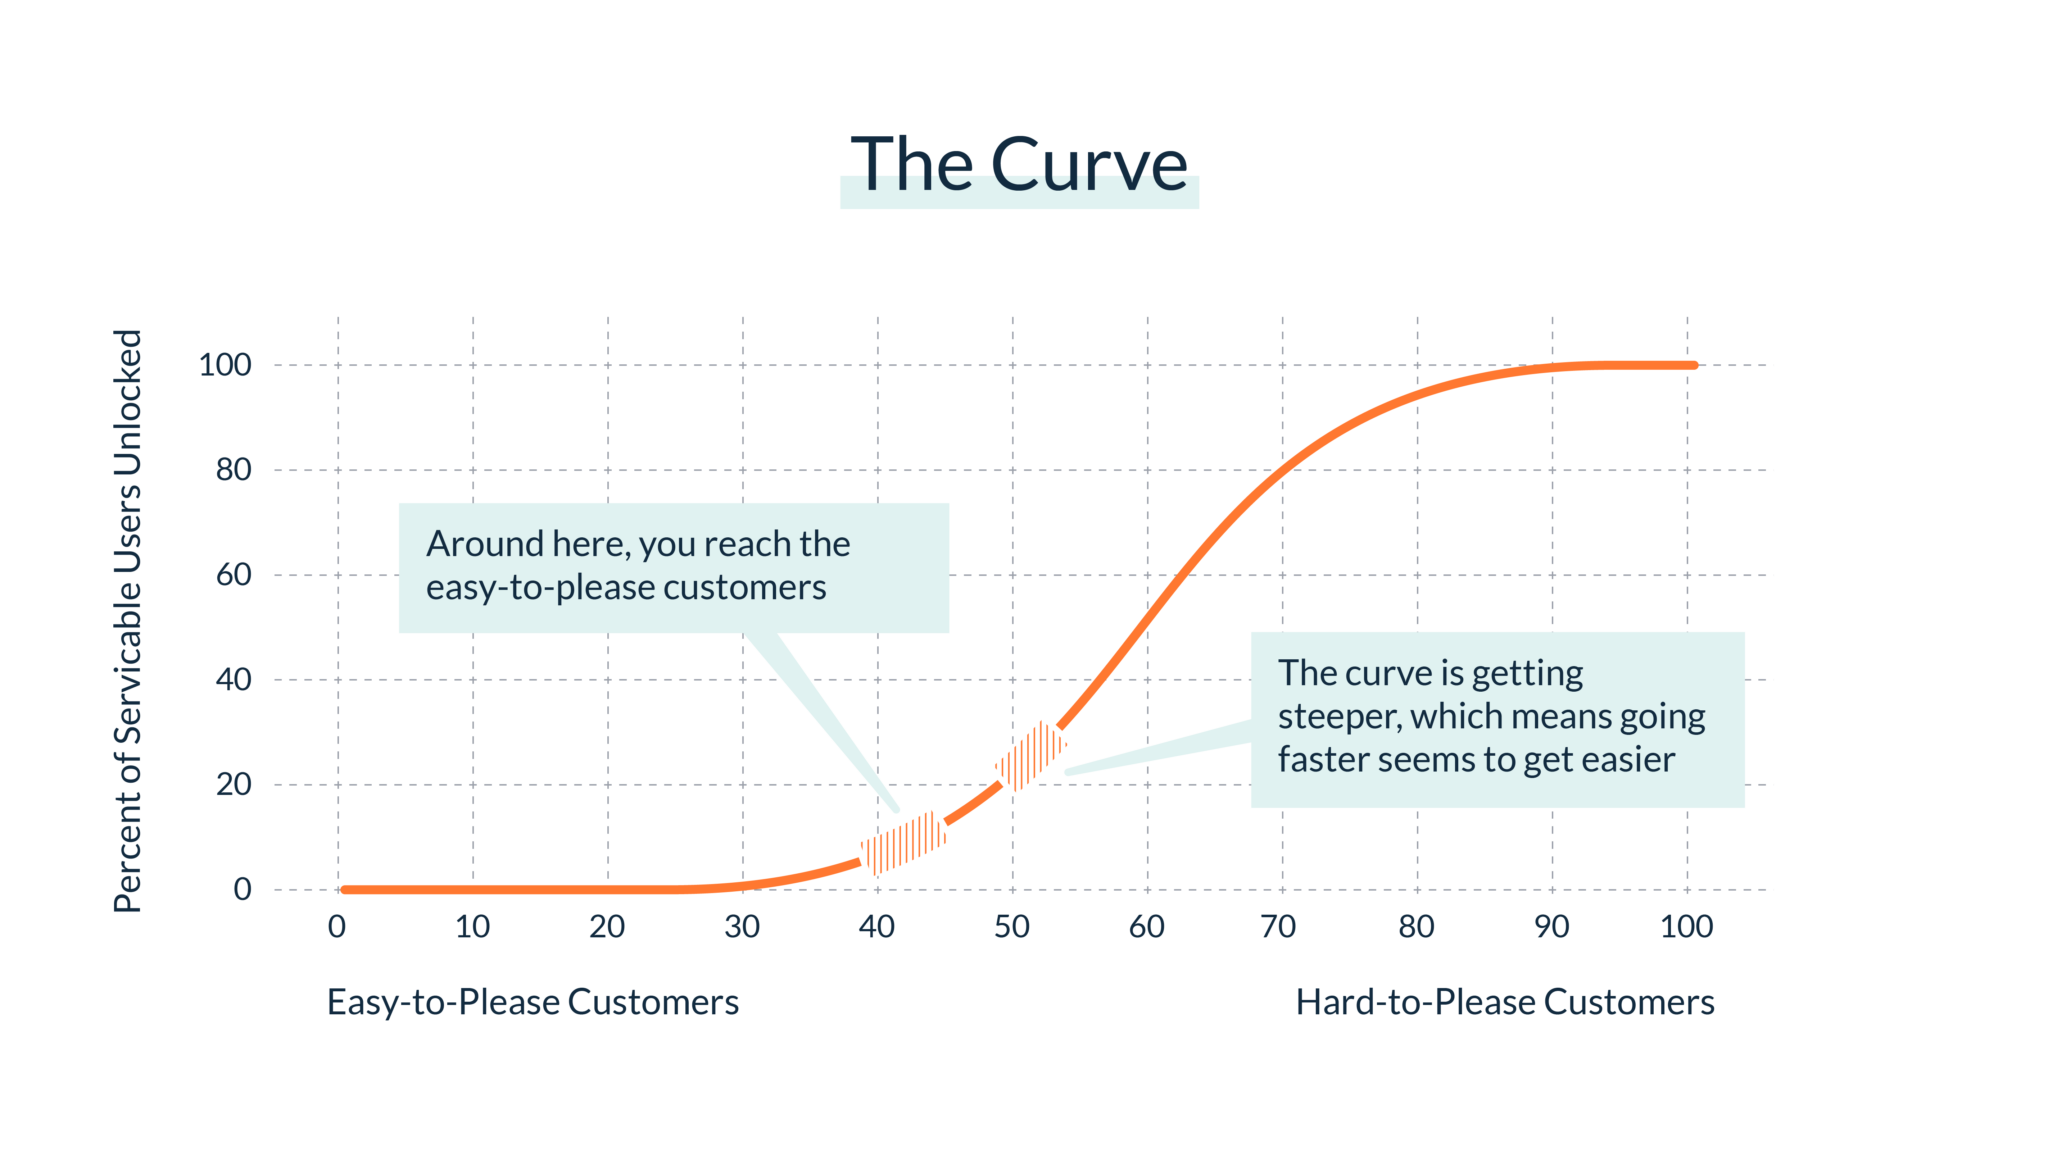
This is “The Curve.” It’s The Curve all entrepreneurs climb when serving a target segment of customers. By having a curve to explain the entire entrepreneurial journey within one segment of customers, we finally get what all the PMF conversation has been lacking: a full map rather than a “you are here” sign.
We can see the flat left side of The Curve when you’re building but nobody is buying yet. We can see the way the business first “lifts off” when it starts getting steeper (these are the earliest signs of PMF). We can then see how it seems to “get easier” as each step to the right yields more and more relative lift. Then, we see what happens when we pass the mean of customer needs and start unlocking smaller and smaller customer segments. Lastly, we see full market saturation at the far right, with slower and decelerating growth.
Suddenly, the entire entrepreneurial journey seems to make a lot more sense when you can see it all at once.
Navigating the Curve
No matter the stage you’re at, The Curve can offer some interesting insights about what you might be experiencing. But for early-stage entrepreneurs, here’s the most compelling insight:
If you’re headed in the direction of PMF, you should feel it getting easier each month.
Some have called it the market pulling you, like Adam Smith’s Invisible Hand. What that means in practice is, if you’re climbing the start of The Curve, then you’re gradually unlocking progressively larger customer segments whose needs match your offering.
For every step you take to the right, you’re gaining exponentially more elevation than the prior step. As this continues, it will feel like you’re surfing a wave of success.
This is exactly what we’ve been experiencing as Visor’s grown. What once started as a random trickle has grown into a wider and wider river. That’s because our product is developing more fit, and as we do that, we’re unlocking even larger groups of customers we can serve.
That’s not to say that our daily workload has gotten lighter. Ironically, it hasn’t. But the push towards product-market fit gets easier. More customers who consider the product decide to stick with it. And it seems that each step we take offers more rewards than the last one. It’s a really thrilling experience.
Going narrower to go faster
It’s important to note that The Curve only applies to a very narrow segment. It can’t easily represent multiple products sold to different customers. Those are just a variety of curves.
That explains why it’s so important to focus narrowly. You want to get to the thicker parts of one curve as quickly as possible as opposed to slowly climbing the flat parts of numerous curves. Having too wide a focus makes it harder to go faster and harder to know if you’re truly making progress.
Conclusion
Contrary to all the currently-available wisdom on PMF that says “you’ll know it when you see it,” there is, in fact, a way for you to know it before you see it. And The Curve explains a lot more than that. It also explains why acquiring customers seems so hard at first (when you’re on the flat part) but eventually gets easier. And, as I’ll write more about in later posts, it helps explain the math behind concepts like “barriers to entry,” growth inflection points, and the later stages of slowing growth.
With an application of simple statistics, entrepreneurs can see if they are on the right path towards PMF and understand what it feels like as their product develops, meeting the needs of wider and wider segments of the market.
Further Reading
P.S. If you want to reacquaint yourself with the basic statistics I cited, I highly recommend the work of statistician Jim Frost, who explains these concepts in detail on his own blog, including the central limit theorem that explains the assumptions behind bell curves, the Probability Density Function of the classic bell curve, and the cumulative distribution function.