Jira Gantt Charts: Complete Guide & Tutorial


Start using Visor today
- Visualize all your projects and data

- Roll up multiple projects into portfolio views
- Try Visor for FREE
Jira Gantt charts allow project managers to plan, schedule, and communicate timelines meticulously. They’re an important tool for many PMs who spend their days in Jira.
So, it’s no surprise that Jira, one of the most popular apps for project planning, makes it easy to create Gantt charts with Jira data.
Jira offers two built-in roadmap features, often used like Gantt charts: Jira Timeline and Advanced Roadmaps. They also allow external tools to make Gantt charts with Jira project plans.
By the end of this post, we will:
- Give you a quick overview of Gantt charts
- Explain how roadmaps are different from Gantt charts
- Quickly explain the different options you have to create a Jira Gantt chart
- Show you what Jira’s Timeline and Advanced Roadmaps features can (and cannot) do
- Provide two step-by-step guides for making a Jira Timeline chart and a Jira Gantt chart
If you want an easy way to create beautiful Gantt charts with your Jira projects you should use Visor. You can use it to create beautiful Gantt charts of your Jira projects, and portfolios of projects (multiple projects in a single view).
These Gantts can be shared with all your stakeholders, even if they don’t have Jira access. Visor has a powerful integration with Jira, but sits outside Jira itself, which means you don’t need to buy a Visor license for every Jira user you have.
This enables you to create better Gantt charts with your Jira data, without having to get a budget breaking upgrade for every user in your Jira instance. Learn more about why Visor is better than a Jira Gantt plugin, or get started with a free trial of Visor now.
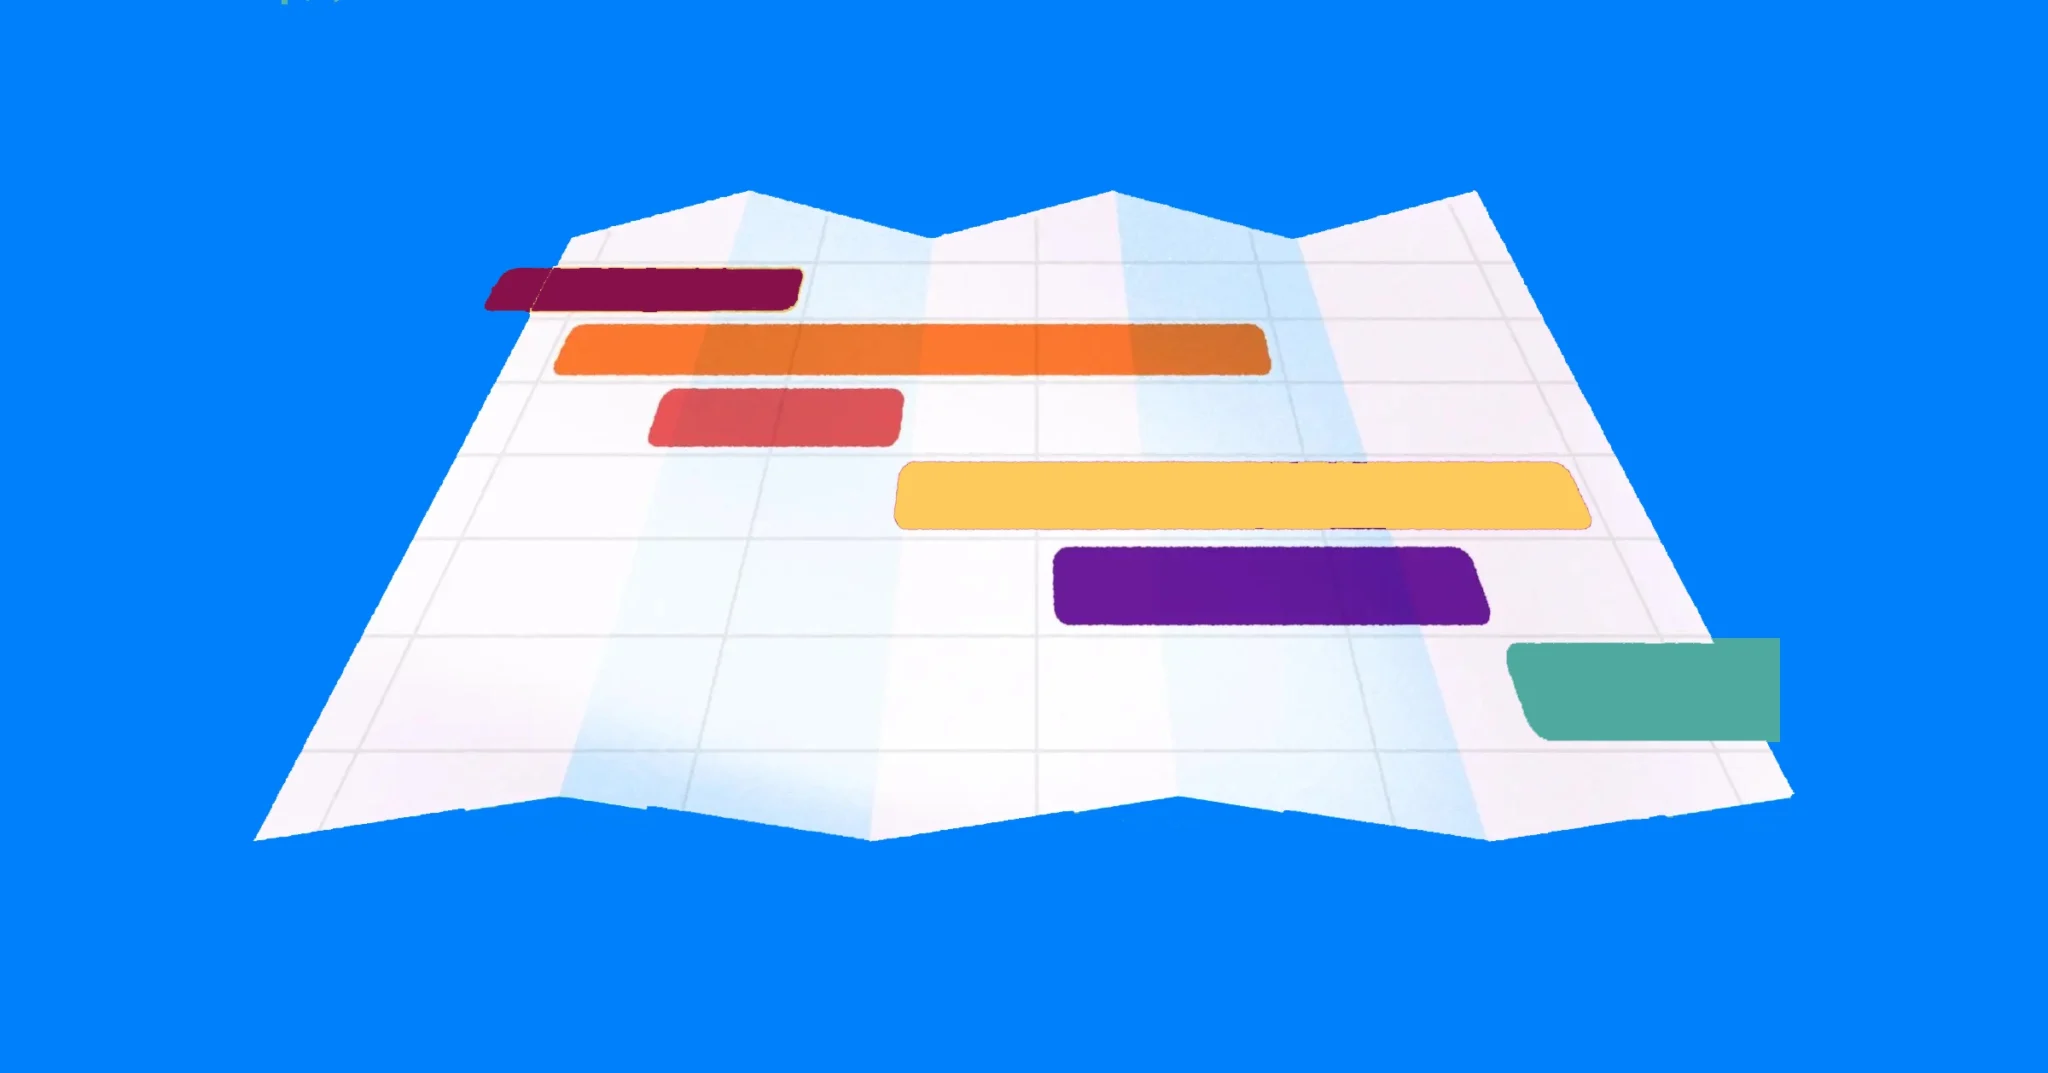
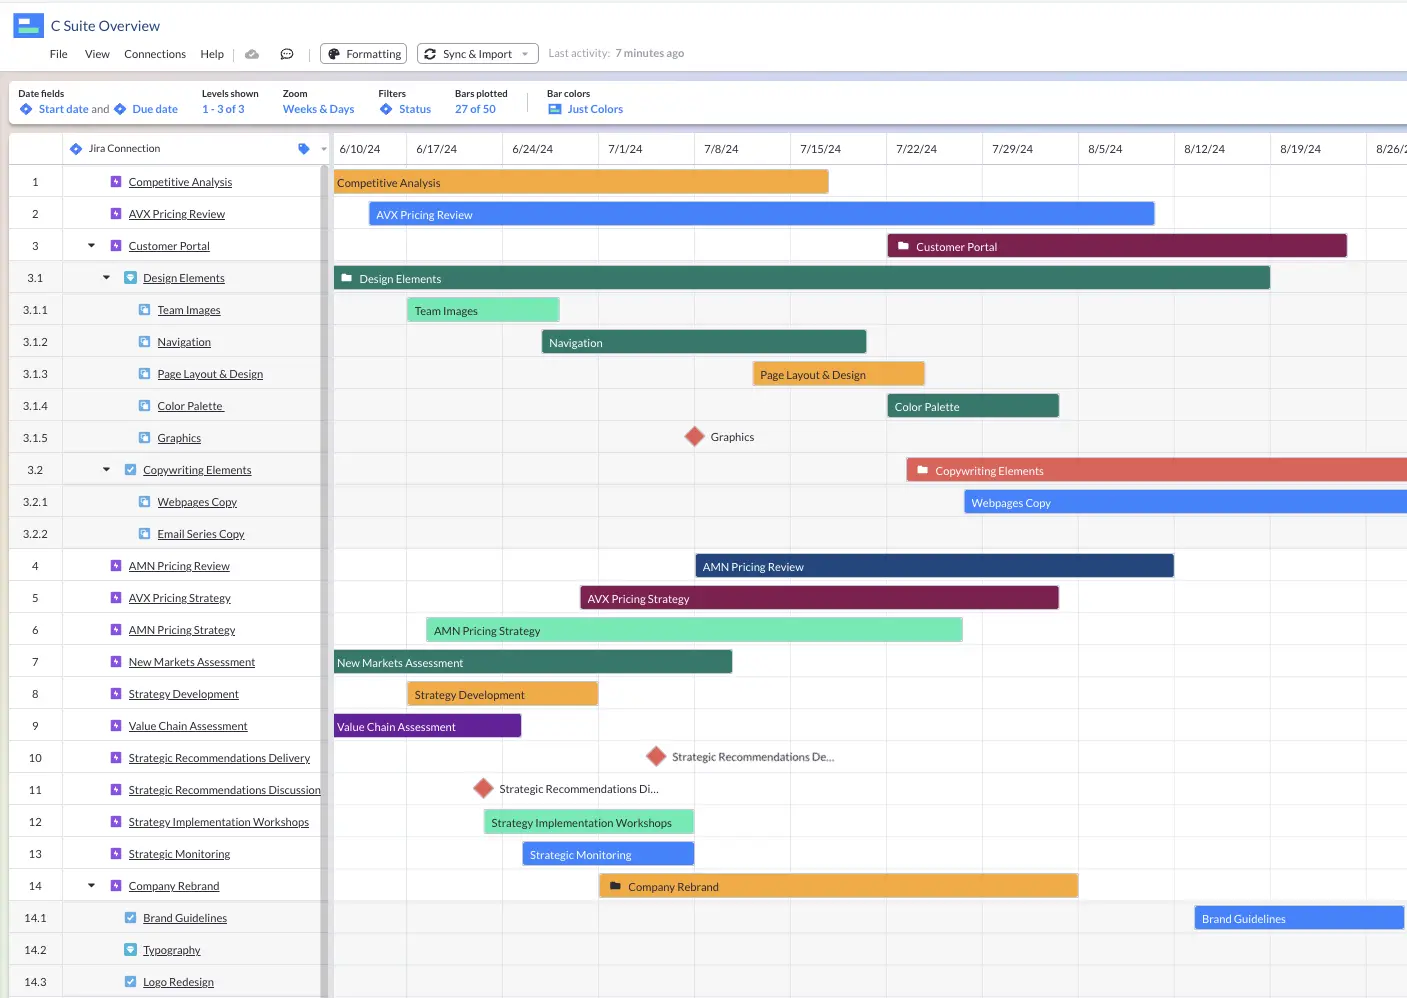
Gantt chart in Visor using real-time Jira data from multiple Jira projects, complete with milestones and additional Visor custom fields to add extra context:
A Quick Overview of Gantt Charts
The Gantt chart’s arrangement of tasks, timelines, and progress paints a clear view for project managers and their teammates to work efficiently.
Invented by Henry L. Gantt, a famed engineer and management consultant, Gantt charts forever changed project management in the early 1910s. From the start, Gantt designed his charts so supervisors could know whether or not production was on schedule. As a visionary thinker, Gantt understood the power of visual representation to clearly and concisely depict project timelines and progress.
What is a Gantt chart?
A Gantt chart is a detailed bar chart showing a project’s tasks and completion time, helping project managers know what to do and when.
These charts have three parts:
- On the left, there’s a list of tasks.
- On the right, there’s a timeline with bars illustrating when a project starts, finishes, and overlaps.
- On top of the horizontal bars, there are dates or time periods (e.g., months, quarters)
Example of a Jira Gantt chart made in Visor, including multiple Jira projects:
Does Jira Have Gantt Charts?
The standard (free) version of Jira does not include Gantt charts. It does include a timeline view, but this is not the same as a Jira Gantt chart. It lacks important functionality like the ability to display subtasks and other nested data.
Jira Plans – Native Jira Gantt Chart
If you upgrade to Jira Premium you’ll have access to Jira Plans (formerly Jira Advanced Roadmaps) which offers much more functionality than Jira’s Timeline view. Jira Plans is closer to a real Jira Gantt chart, but it still lacks some important Gantt chart functionality, including the ability to add Gantt chart milestones.
Jira Gantt Chart Plugins and Apps
Jira plugins (and apps with two-way Jira integrations like Visor) give you the ability to create real Jira Gantts without the drawbacks of Jira’s native Gantt chart options. Using an a Gantt chart app that connects to Jira (like Visor) makes it possible to share live Jira Gantt charts with any stakeholders, even if they don’t have access to Jira.
Visor – The Best Jira Gantt Chart App
In Visor you can create Jira Gantt charts using your live Jira data, that maintain and display all your hierarchies (your epics, stories, tasks, subtasks etc.), including your custom hierarchies, dependencies (or linked issues), and milestones. Visor Gantt charts also give you much greater color coding options.
Because Visor is an app, not a plugin, you can share your enhanced Jira Gantt charts with anyone you want, providing guest access for collaborators who don’t use Jira.
Visor offers free project management Gantt chart templates and release roadmap templates that allow you to import Jira data.
You can even create custom Gantt versions for different stakeholders. For example you can create an epic-only roadmap view for your exec team, and a fully detailed version for your own team, all based on the same live Jira data.
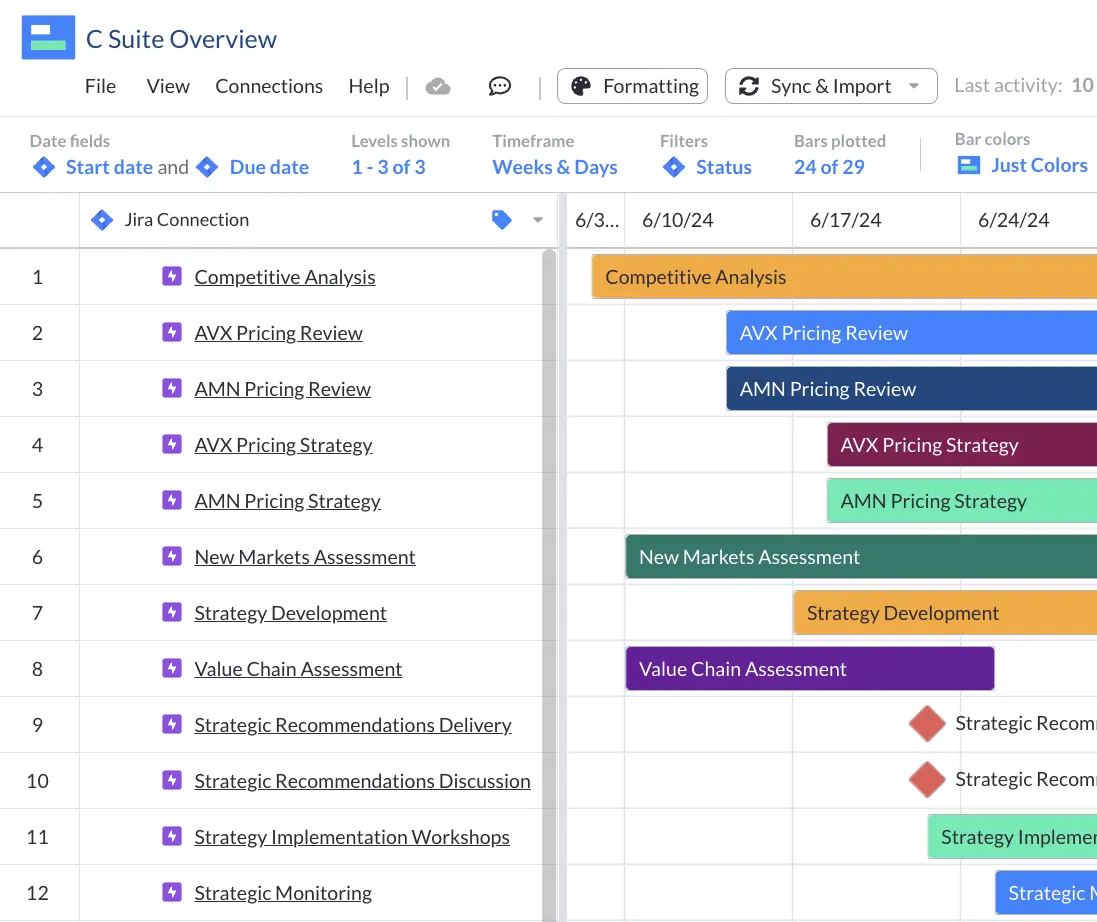
A Gantt chart created in Visor using live Jira data and only showing epics, designed to keep C suite stakeholders updated:
Jira Gantt Charts For Multiple Projects/Portfolios
Visor allows you to import multiple Jira projects to create Gantt charts (and other visualizations) that incorporate multiple projects in a single visualization (often called a portfolio view).
You can determine what level of detail to show on each Gantt chart, which projects and issue types you want to import and show, and so on, giving you a way to view, manage, analyze, and share your portfolio of Jira projects in an easy and highly flexible way.
This functionality typically only comes with an enterprise project portfolio management (PPM) tool like Jira Align or expensive Jira portfolio plugins. Visor gives you PPM software capabilities minus the complexity and the budget-breaking costs.
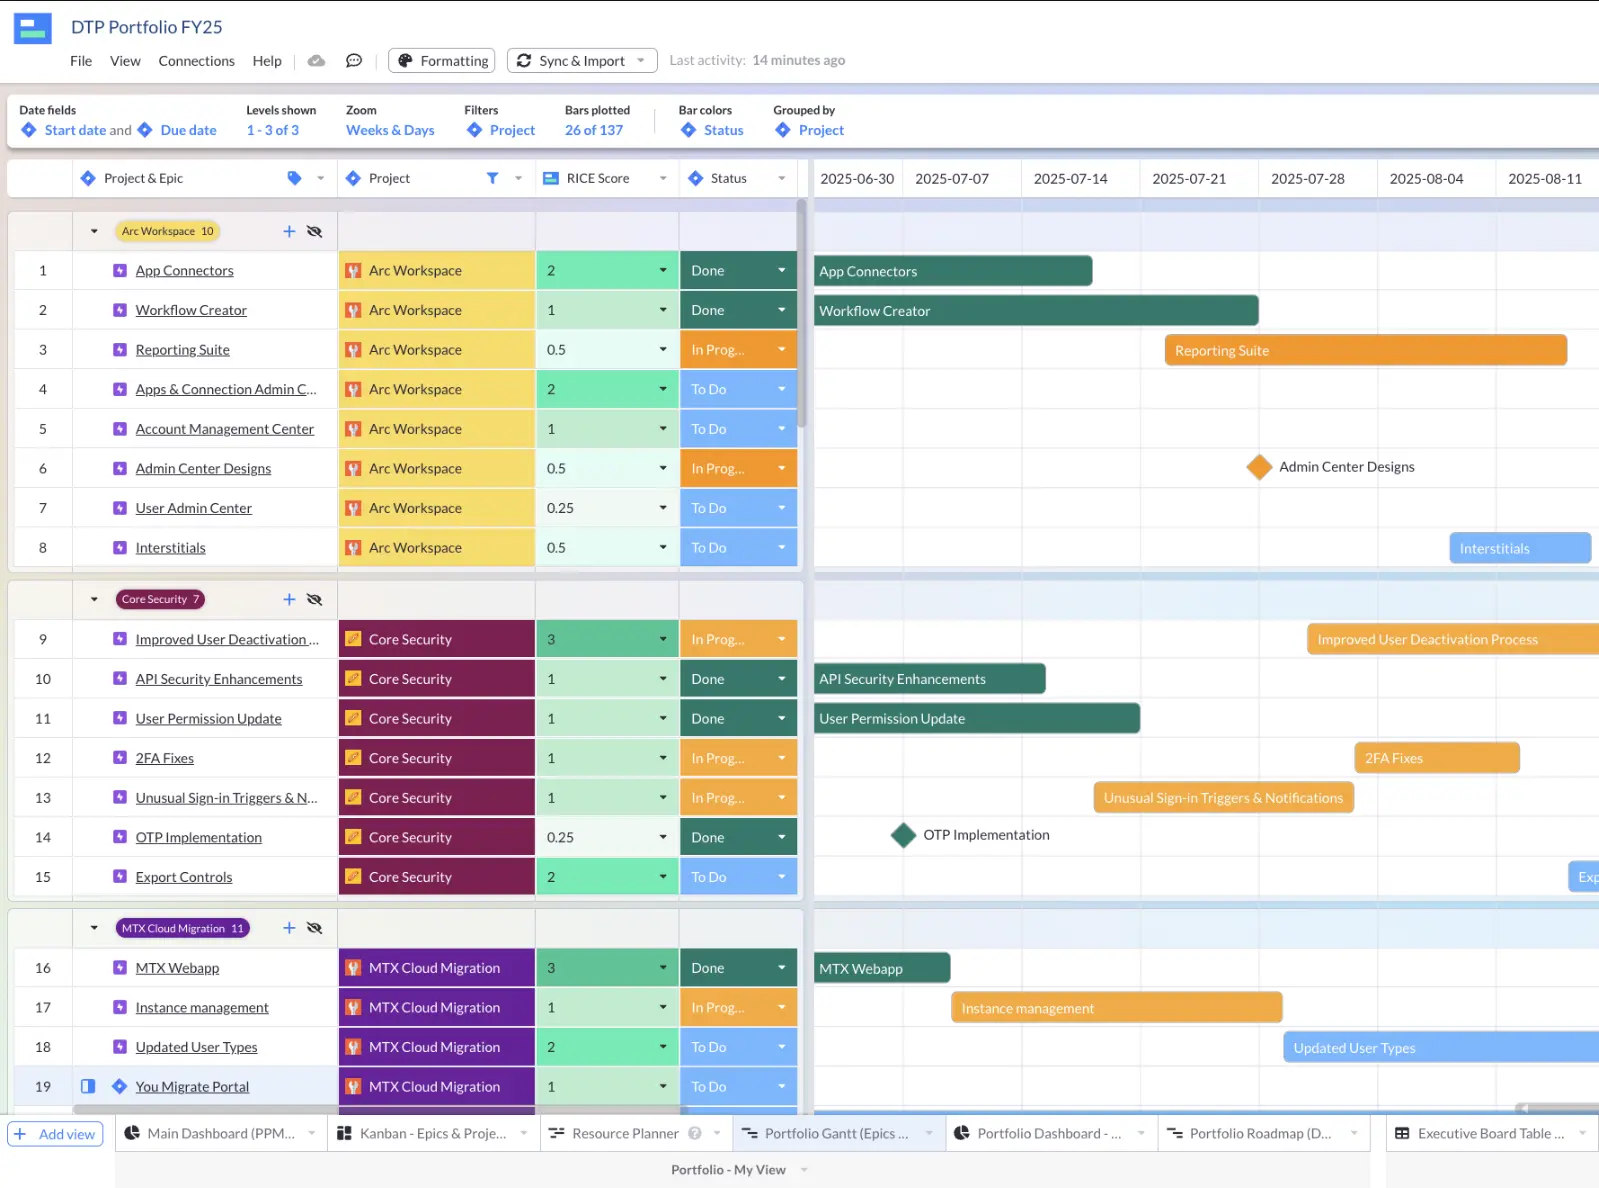
A Gantt chart in Visor using multiple Jira projects using our project portfolio template:
Jira Gantt Charts vs. Roadmaps: Common Use Cases
Many people use Gantt charts and roadmaps interchangeably. Even Jira’s “Advanced Roadmaps” is often used as a Gantt. However, roadmaps and Gantt charts are different; we explain why in this section.
Roadmap 101:
A roadmap is NOT a project plan.
Instead, a roadmap provides a high-level view of what your team will or could deliver. For example, in a traditional software development lifecycle, users collaboratively identify concepts for potential future work and include them in a roadmap to be vetted later.
Roadmaps are also fantastic for aligning your project with your company’s vision and sharing with external stakeholders. Often, roadmaps will show things only on an epic level (especially for portfolio management). Rarely do portfolio roadmaps drill down to the subtask (or even task) level.
Jira offers Timeline (formerly Basic Roadmaps) and Advanced Roadmaps (formerly Plans), which look a lot like Gantts. We’ll dive into these features more in-depth in the next section. In the meantime, we’ll cover how roadmaps and Gantt charts are used.
Common Use Cases for Roadmaps:
- Share high-level strategy and deliverables with external stakeholders
- Compile projects to vet for potential future work
- Align future projects with company vision
While roadmap tools like Roadmunk integrate with Jira, they don’t always make it easy to create more granular Gantt charts. Instead, they are optimized for more strategic work. Let’s dive into Gantt charts now and see what options you have to create them with Jira data.
Gantt Charts 101:
Unlike roadmaps, Gantt charts include detailed project plans; they are the blueprint of what will get done and by when. Like roadmaps, Gantts need Start and End fields for you to plot them. However, unlike roadmaps, Jira Gantts typically drill down to the task or subtask level.
There is often confusion between roadmaps and Gantt charts because the outputs can look identical. Adding more confusion to the mix, Jira’s built-in Gantt options are called “Advanced Roadmaps” and “Timeline.” However, roadmaps typically offer a more strategic view into prioritization, while Gantts are purely tactical.
Roadmaps are a crucial strategy for agile portfolio management, which Gantts offer a more nitty-gritty view into what’s being done. If your stakeholders crave a granular look at projects and increased visibility you’ll want to share a Gantt with them.
Common Use Cases for Gantt charts:
- A visual representation of a plan’s progress and timing
- To see a project’s dependencies (or linked issues) and milestones
- Resource allocation and Jira capacity planning
Why Agile Teams Use Jira Gantt Charts
Gantts might be a dirty word among some agile purists. After all, the iterative agile process makes it challenging for many to commit to due dates (which Gantt charts require). That’s why so many agile teams spend a lot of time structuring the best Kanban flows imaginable.
Nonetheless, agile Gantt charts are still a thing. Below is an overview of the benefits that these charts can provide.
1. A panoramic view breeds clarity. 🌄
When setting up and managing a project, Gantt charts provide a panoramic view of how all the pieces will come together. As a project manager, you can see what isn’t finished yet, who’s responsible for each task, and when they should complete their part of the project.
This visual clarity ensures that everyone on your team is on the same page and working harmoniously.
2. Visualizing project plans makes stakeholders happy. 😺
Another benefit of using a Gantt chart is the ability to present a clear visual representation of your project’s timeline. This clarity lets you quickly assess how various components fit together and whether the project is on track, which is invaluable during team meetings and stakeholder briefings.
By adding visual cues to Gantt charts like Jira Milestones, project managers can provide clarity. In short, Gantt charts foster transparent communication and informed decision-making.
3. Resources get allocated more efficiently. ✅
By mapping out tasks and their deadlines, Gantt charts help allocate resources effectively.
You can identify potential resource bottlenecks and ensure that you’re leveraging each team member’s skills. Efficient resource allocation enhances productivity and minimizes resource conflicts, keeping your project on a steady course toward successful completion.
4. Plan for contingencies like a pro. 👊
Let’s face it: The unexpected can happen anytime. Gantt charts allow you to plan and analyze those “what-if” scenarios. When unexpected changes occur, or new information arises, you can explore various hypothetical scenarios by adjusting task durations and assignments directly within the Gantt chart. By simulating different scenarios, teams can make informed choices that help to mitigate risks and optimize project outcomes, enhancing overall project flexibility and adaptability.
Jira’s Built-In Gantt Chart Options
Jira offers two Gantt-like features: the Timeline feature is available for all plans (Free, Standard, Premium, and Enterprise), while the Advanced Roadmaps are available only when users have a more expensive Premium or Enterprise plan.
Top Questions About Jira Gantt Charts & Roadmaps:
1. Does Jira have native Gantt charts?
Yes, kind of. Jira used to have both a “Roadmap” and an “Advanced Roadmaps” feature, which look and act like Gantt charts. However, Atlassian changed their Basic “Roadmap” to “Timeline” in May of 2023. Both of these features are still used for high-level roadmap use cases. However, many project managers also use them for planning projects with Gantt charts.
2. What are the limitations of Jira’s Timeline (formerly Roadmap) Gantt chart?
While Timeline is included in all Jira plans (including the free plan), it does have these limitations:
- Timeline does not allow you to show Subtasks, which can be limiting if you need a Gantt that gets into the nitty gritty. Despite users voting for this Subtask feature, Timeline only allows you to show Epics with their corresponding Story, Task, and/or Bug.
- Timeline does not allow you to include multiple projects in one view, which can make it challenging to show a large overview of multiple initiatives. Atlassian says it best with this quote:
The basic roadmaps feature on Jira Software Cloud is targeted at a single software team with one project per roadmap. Currently, this view only works with issues from the backlog associated with one project.
- Timeline not display issues based on start or end date or any other criteria other than Issue ID.
- Timeline does not allow you to set custom colors. The colors are determined by the statuses of the corresponding Epics/Issues.
For a quick overview of Jira’s Timeline option, check out the YouTube short we made.
3. What is Jira’s Advanced Roadmaps feature?
Jira’s Advanced Roadmaps is a paid feature in the Premium and Enterprise plans. Advanced Roadmaps provides more functionality than Jira’s free Timeline view; it can show subtasks and offers cross-project planning. Due to these features, Advanced Roadmaps can enable the management of more complex projects across multiple teams.
Some limitations of Advanced Roadmaps include limited sharing functionality for unlicensed members, not being able to choose specific colors for your Gantt, and requiring some training and configuration to get started. Still, Advanced Roadmaps is a popular solution for Jira users who are on top-tier Jira plans.
Free Jira Gantt Chart Options
Jira Timeline
As discussed above, only Timeline view is available as part of Jira’s free plan. Whereas Advanced Roadmaps are included in Premium and Paid plans. If you want to add subtasks, connect Jira projects together, format your table with certain colors and so on, you may find Timeline view limiting.
Excel or Google Sheets
If you can’t or don’t want to upgrade to a Premium or Paid plan, you could try exporting Jira data to Excel or Google Sheets to construct a Gantt in a spreadsheet.
There are even Jira Google Sheet integrations that help you connect the two apps.
However, as you can probably imagine, you’ll need to create the Gantt in your spreadsheet from scratch, keep importing/maintaining and formatting the data in it, and even once all that is done, you still will have a bit of a patched together, untidy and unimpressive Gantt chart for your Jira data.
All this extra work makes Excel/Google Sheets a worse solution than Jira’s Timeline view.
Visor
A free Jira spreadsheet alternative to Excel or Jira’s built-in Timeline feature is to use a complimentary tool like Visor.
Tools like Visor present your Jira data in a range of views, including Gantts and boards. Visor has all the full functionality of a Gantt based planning system, plus a bi-directional integration with Jira, so you don’t need to manually update data, or worry about everything staying in sync.
Visor has paid plans, but the free version is pretty unrestricted, so you’ll have everything you need to create colorful, intuitive Gantt Charts all using your existing Jira data. Other spreadsheet-inspired workspaces (like Smartsheet) can charge a lot for their Jira integrations. With Visor, you can integrate for free.
In Visor you can visualize your Jira projects (or multiple projects) on a Gantt chart, complete with project milestones and dependencies (aka linked issues) – including cross project dependencies too.
In the sections below, I’ll cover how to create Gantt Charts using Jira Timeline and Visor so that you can pick the right approach.
You should also watch this review of Visor as a Jira Gantt chart builder from Apetech Tech Tutorials:
Visor’s Jira Gantt Chart:
Three Jira Gantt Chart Options: Quick Overview
Option #1: Timeline Chart in Jira
Because Jira’s Advanced Roadmaps is only available with Premium or Enterprise plans, we’ll cover the free (but more limited) Timeline feature in Jira. As stated in the above section, this option does not allow you to include subtasks, bring in more than one Jira project, or choose specific colors for your Jira Gantt chart. Also, you cannot share your Jira Timeline with people outside of your Jira instance that easily.
In addition, you can not add Jira milestones to the built-in Gantt / roadmap options that Jira offers.
However, Timeline does provide dependencies and works for basic resource allocation.
Option #2: Jira Gantt Chart in Visor
Visor is not a built-in roadmap option within Jira. Rather, Visor is a separate app that integrates with Jira, allowing you to circumvent a lot of the limitations of Jira’s built-in Gantt options (e.g., Milestones, sharing Gantts with stakeholders who don’t use Jira).
We’ll also go over how to make a free Gantt chart with your Jira data in Visor for folks who:
- Share their Gantt charts with stakeholders who don’t access Jira
- Need to connect multiple projects in a Gantt or add Subtasks
- Want additional color and formatting options
In addition, Visor allows you to add custom fields that don’t live in Jira (which your Jira admin will thank you for) and import data from other apps like Asana and Salesforce. With Visor, you can augment your Gantt charts with custom fields and/or data from other sources.
Create Gantt Charts with Data from Jira and Salesforce or other apps like Asana:
Option #3: Jira Advanced Roadmaps in Jira
The previous two options allow you to make a Gantt chart with Jira data for free. This last option, Advanced Roadmaps, requires you to upgrade to Jira Premium.
Jira Advanced Roadmaps offers a lot of the features that Visor does (and that Timeline does not). If you’re on a Jira Premium plan, this feature is available to you. Check out the in-depth overview below of how Advanced Roadmaps differs from Visor and Jira’s Timeline option.
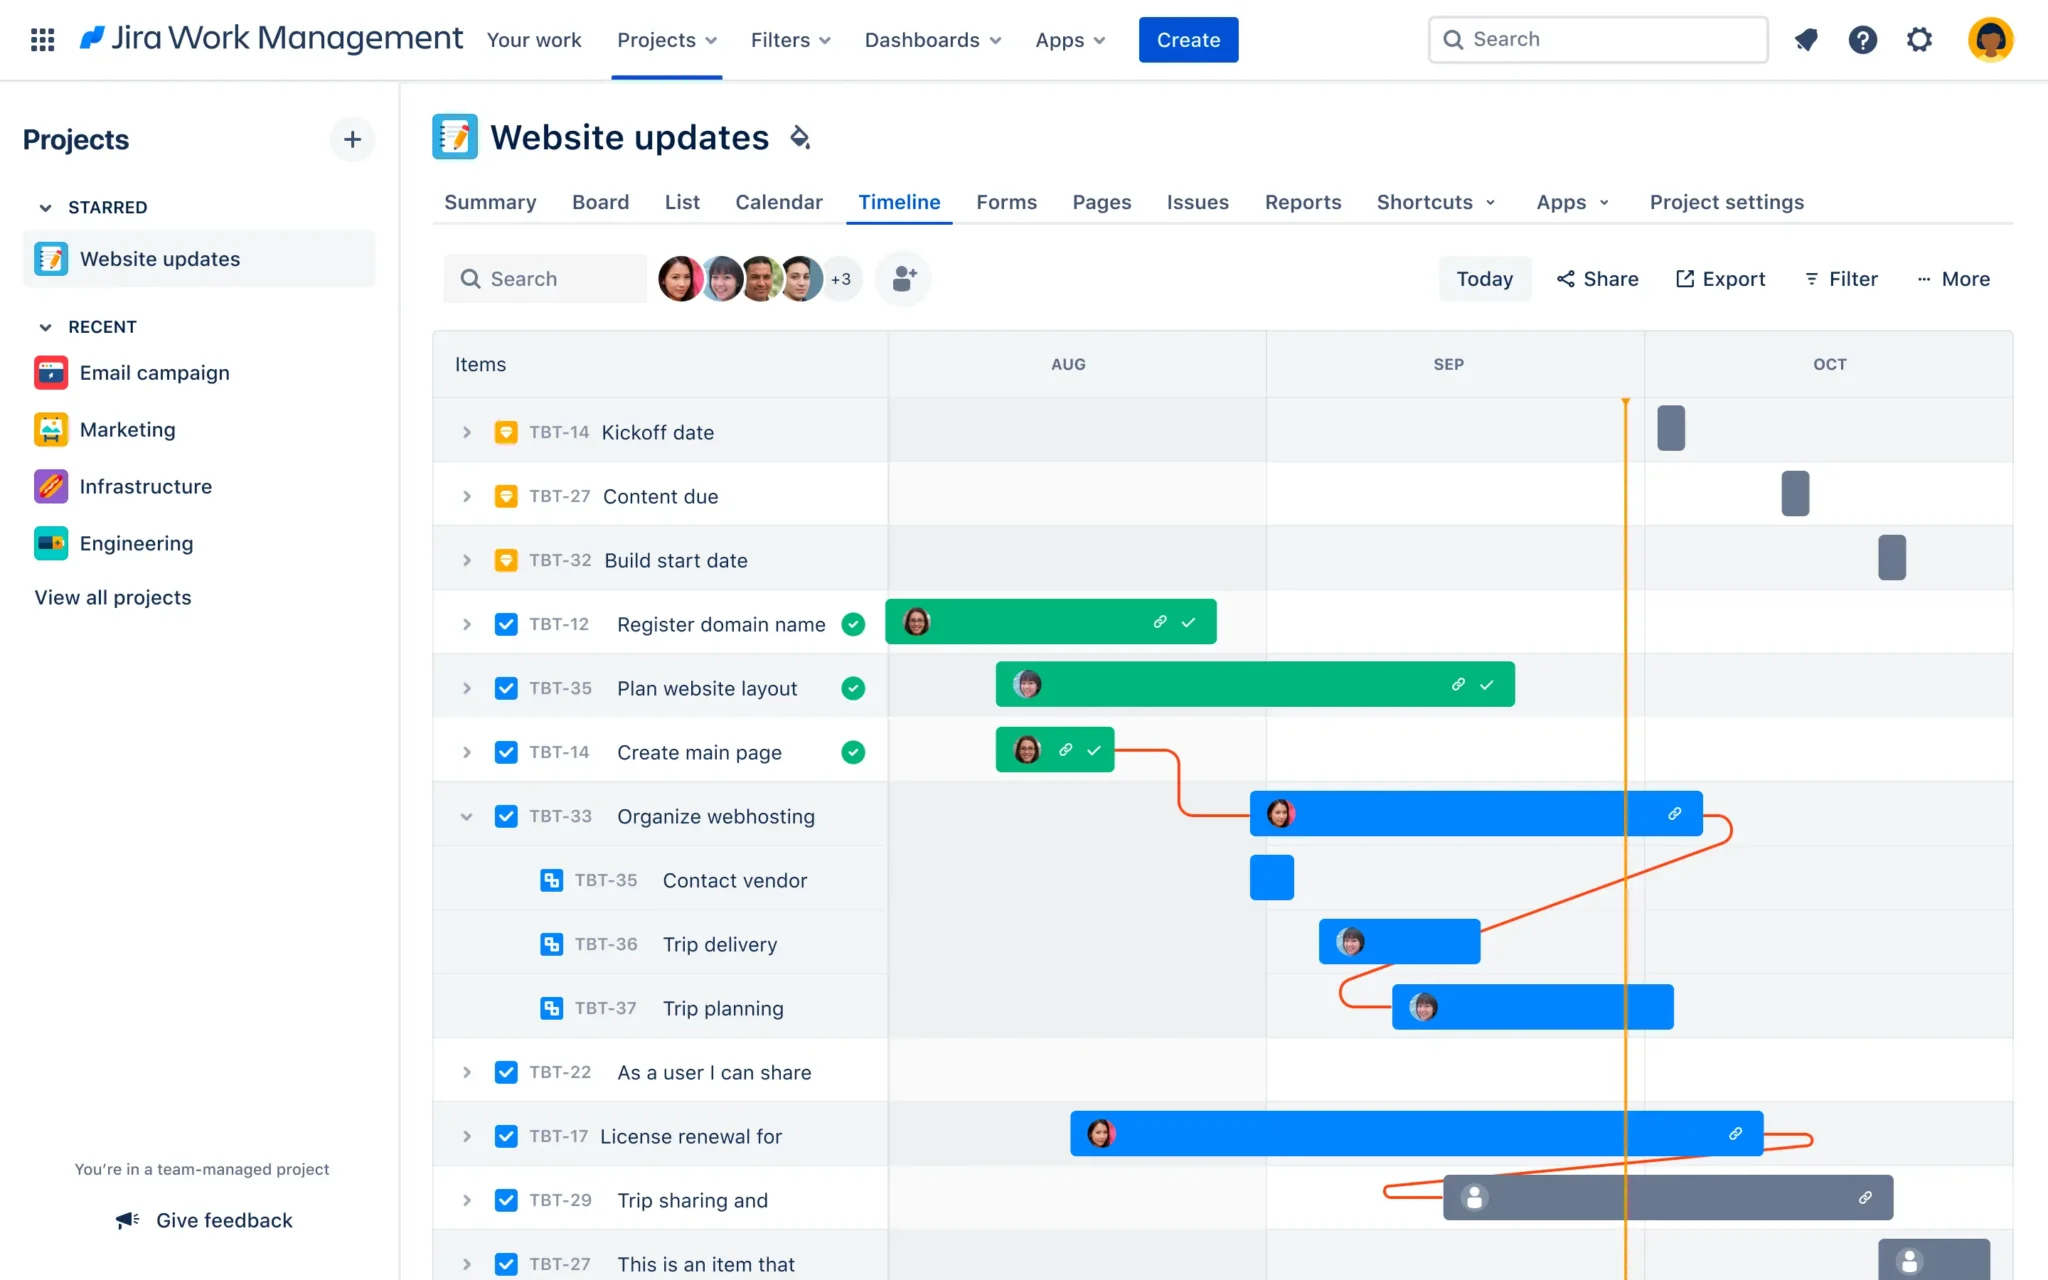
Option #1: Create a Jira Timeline Gantt Chart
Because Jira’s Timeline functionality doesn’t allow Subtasks, this option is best for users who want a basic, high-level view of projects. This feature is for teams who have just one project to work with; connecting projects requires the Advanced Roadmaps option.
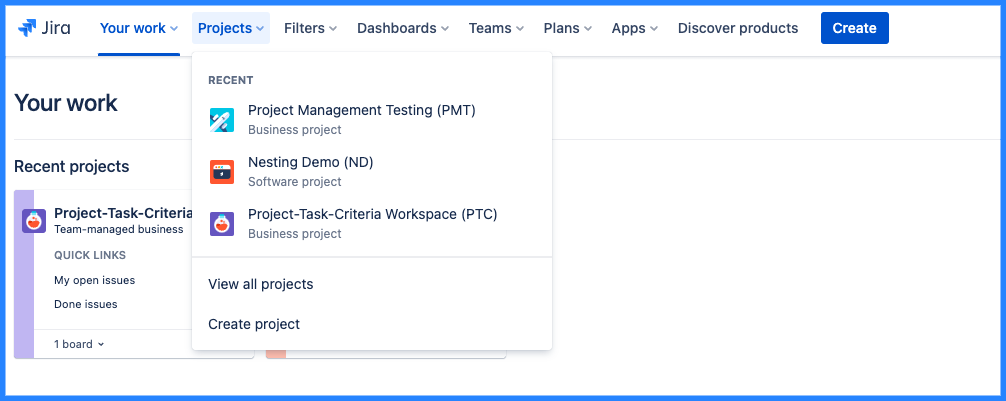
Step 1: Log in to Jira and find the “Projects” tab on the menu bar.
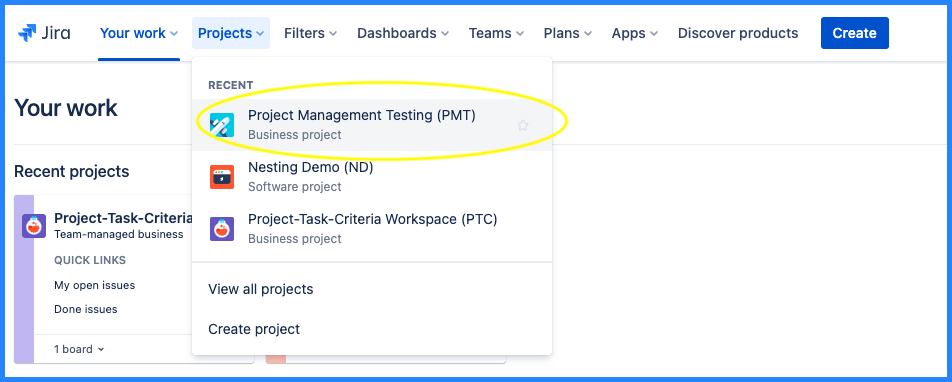
Step 2: Select the Jira project you want to create a Gantt chart or Roadmap with.
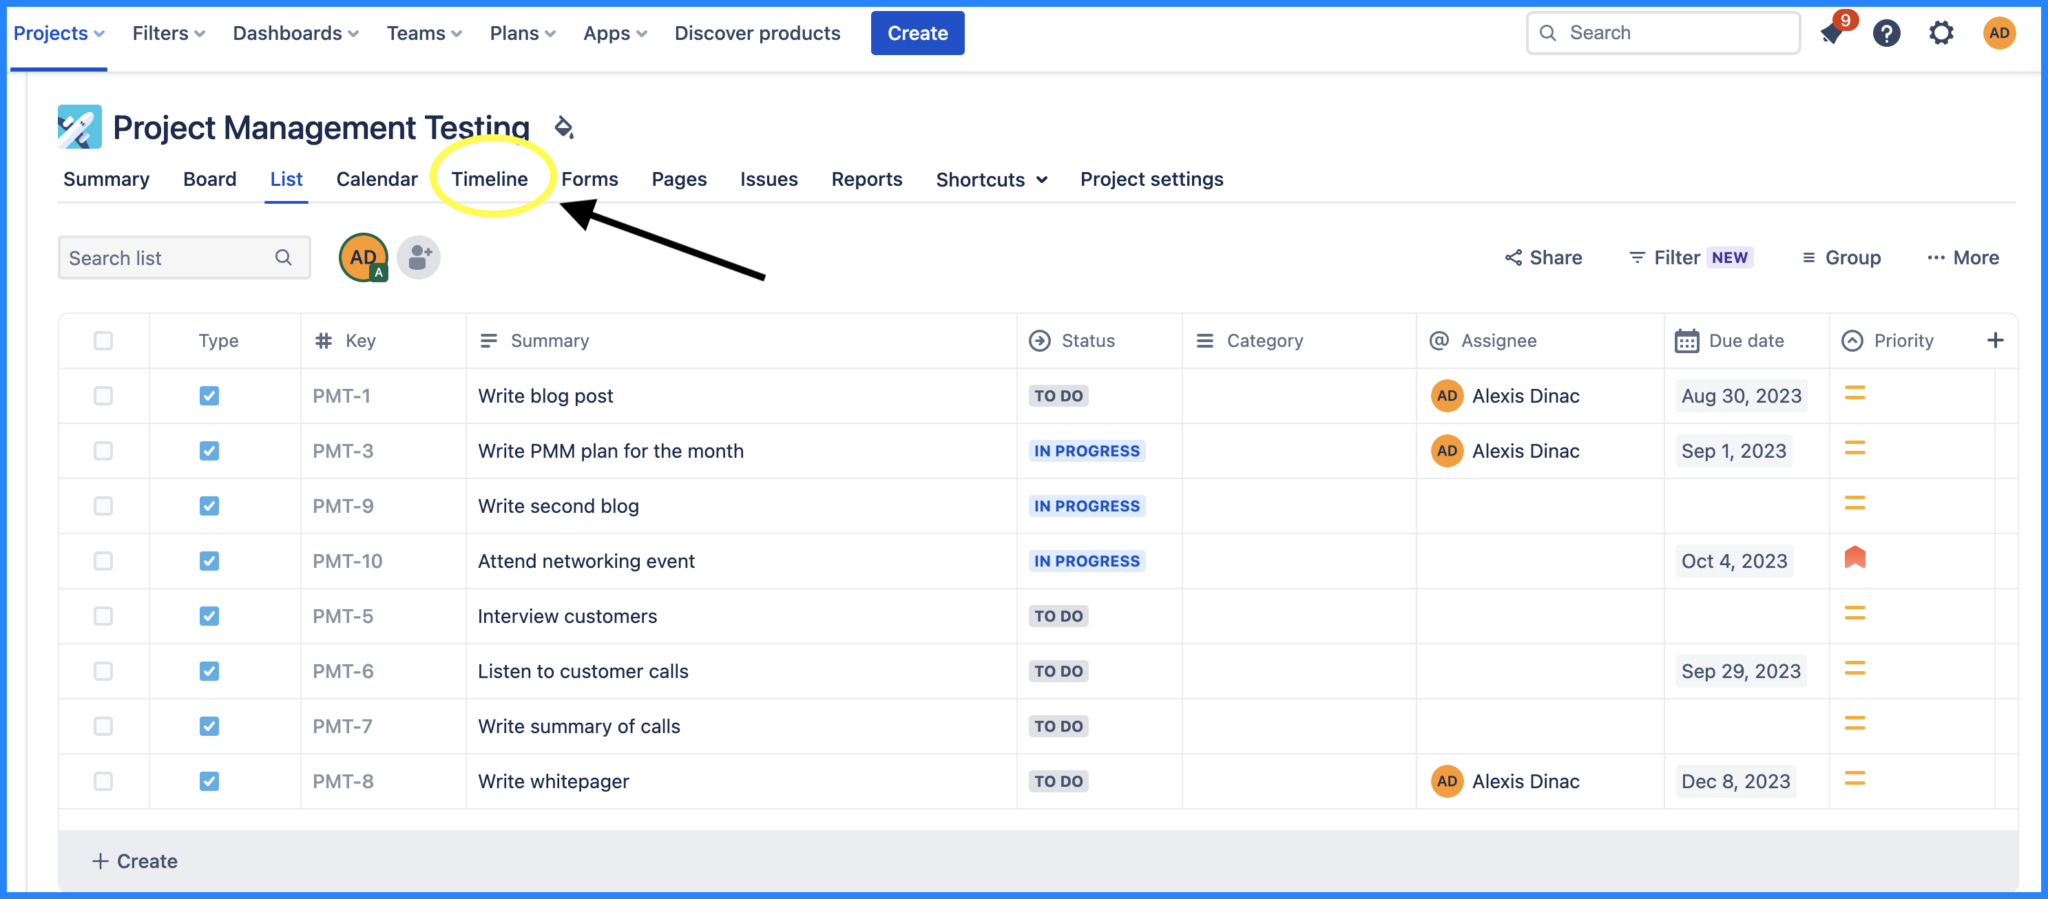
Step 3: Next, click Timeline View to see your Gantt chart.
Note: Jira Timeline is the name of their free roadmap / Gantt feature. Outside of Jira, project managers do not often use the phrases Timeline and Gantt chart interchangeably.
Option #2: Create a Jira Gantt Chart in Visor
With Visor, you can create Jira Gantt charts for free that include Subtasks and Initiatives, connect multiple projects with JQL, and choose the exact colors you want in your Gantt. Visor is free (up to 250 records) and has a popular bi-directional integration with Jira. Visor also supports over 75 types of Jira fields and nested child/parent relationships.
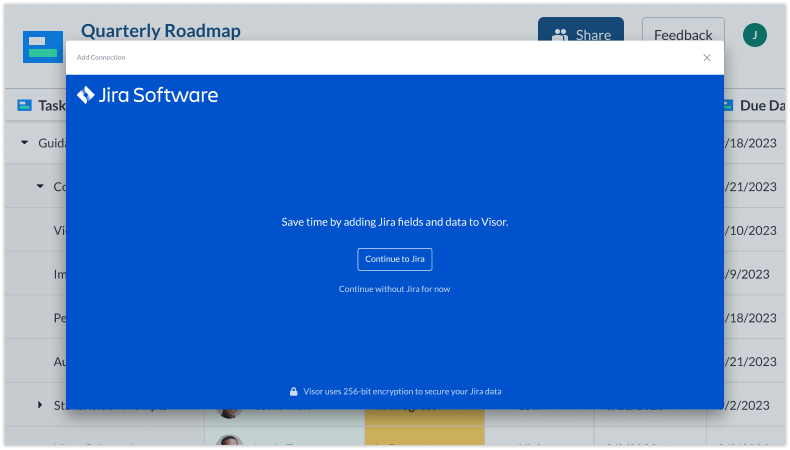
Step 1: Connect your Jira data to Visor.
If you’re new to Visor, create a new workbook and connect your Jira data to Visor. Connecting Jira to Visor is secure, and your data imports almost immediately.
Step 2: Choose the Jira project you want to import.
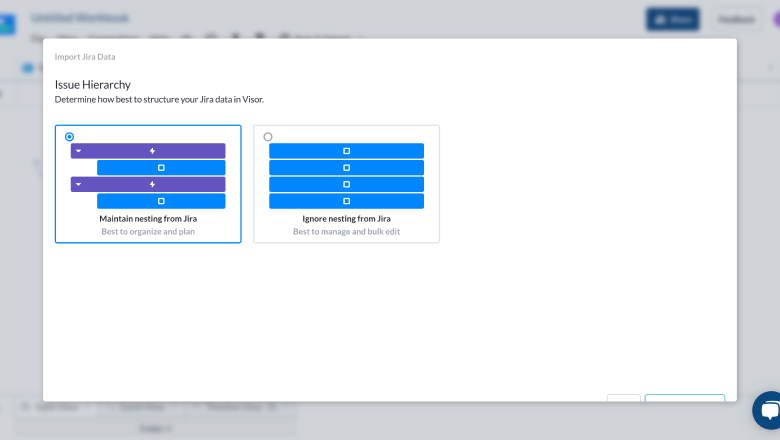
Next, choose the project you want to import and whether you want to maintain or ignore nesting.
Step 3: Once your project is imported. Press the Gantt View Tab.
Once your Jira project imports, press the “Gantt View” tab at the bottom of the screen. Then, you can quickly select the data you want in your Gantt view, including what date fields you want to plot for your start and end dates.
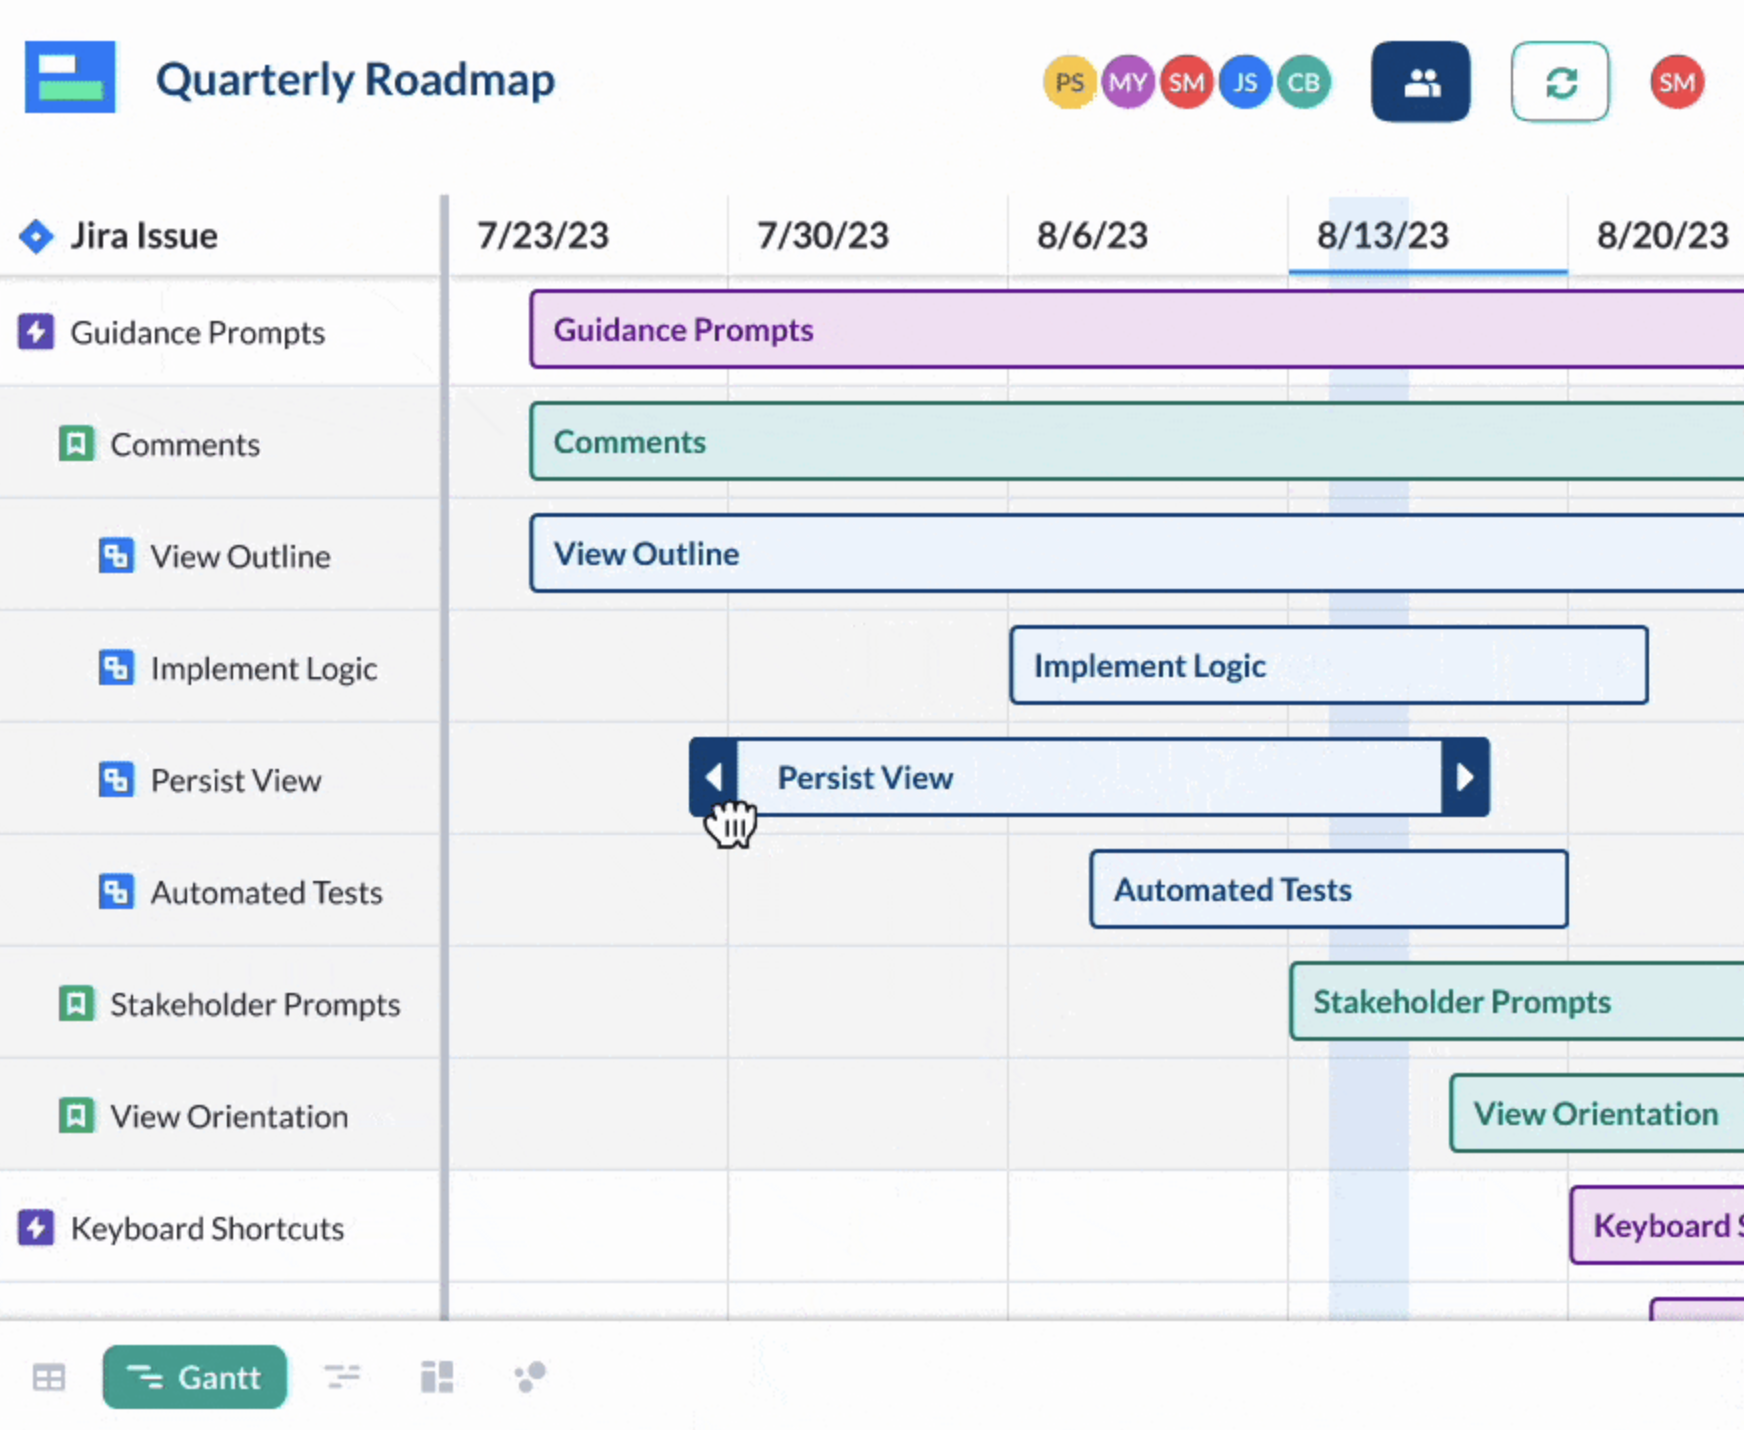
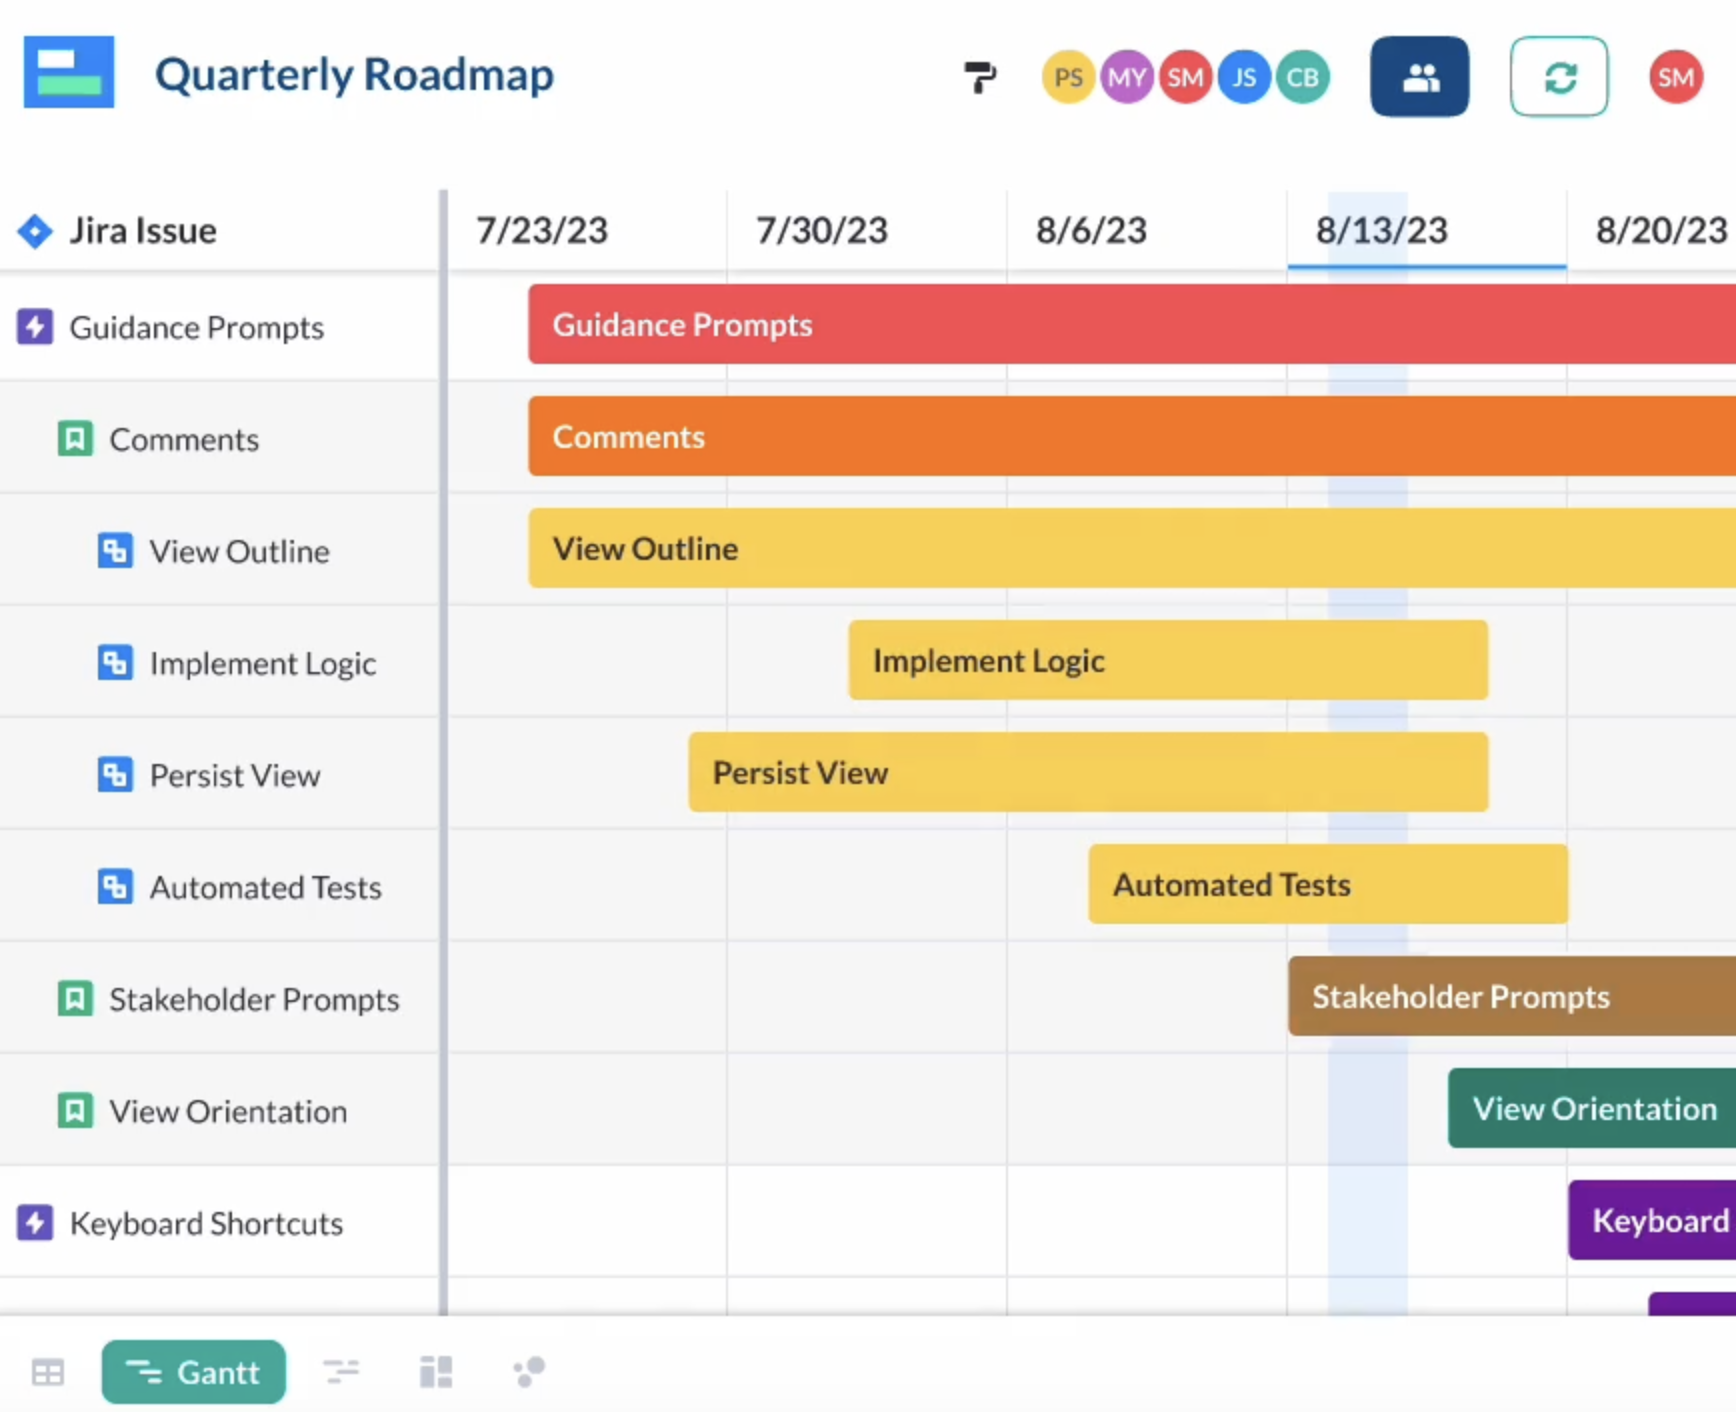
Step 4: Customize and share.
From here, you can easily customize your Gantt chart any way you like, whether it’s your brand colors or your preferred coloring coding system. You can also share it with stakeholders.
Because Visor offers an embed code, you even share your Gantt chart in Confluence.
2-Minute Video Tutorial: Jira Gantt Chart in Visor
Check out how easy it is to make a Jira Gantt Chart in Visor by watching this tutorial.
Ready to get started with Visor?
It’s free to get started with Visor. No credit card is needed. Import your Jira data into Visor today to format, visualize, edit, or share your Jira data.
Jira Gantt Charts With Dependencies – Why You Need Them
In Jira, dependencies between tasks are called linked issues, and there are various kinds of dependencies (or issue links) between tasks, such as:
- Blocks an issue
- Is blocked by
- Is caused by
- Related to
- Is implemented by
- Is reviewed by
- Is a duplicate of
When you’re creating a Gantt chart view of your Jira project or projects, it’s often essential to see how different issues relate to others, to:
- Clarify which tasks need to be completed in what order
- Understand which tasks are most important to keep your project on schedule
- Prioritize work more effectively based on wider project impact
- Uncover why tasks aren’t started on time (e.g., blocked by another unfinished issue)
- Enable teams to collaborate more effectively on dependent tasks
- Deploy resources to tasks that are behind schedule and blocking other tasks
- Improve task and project scheduling
- Understand and connect how tasks in different projects relate and are interdependent
- Track and address duplicated tasks/work
How To Create Jira Gantt Charts With Dependencies (Jira Linked Issues)
To create Jira Gantt charts that show your dependencies (issue links), you have three main options; these are described below, along with their pros and cons.
Jira Plans/Advanced Roadmaps
If you’ve read the sections above, you will already know that Jira Plans (formerly known as Advanced Roadmaps) is only included with Jira Premium. If you have Jira Premium, you can use Plans to create a Gantt-like view, which includes some of the issue links in your projects.
Here are the key things to consider when using Jira Plans to visualize dependencies:
- Only “blocked” and “blocked by” issue links can be visualized.
- Cannot show dependency lines between tasks in different projects
- Cannot show dependency lines between tasks in different groups (those groupings you have selected for your view, such as team)
- Not available for Jira users on the Free/Standard plan tiers
- Cannot be shared with stakeholders who don’t have a Jira license
- Cannot display milestones
- Cannot filter which issue link types are shown in the Gantt view
- This means Advanced Roadmaps/Plans is fine for visualizing very basic dependencies but is not suitable for visualizing advanced dependency relationships or dependencies that span across tasks in different projects or other groupings.
This means Advanced Roadmaps/Plans is fine for visualizing very basic dependencies, but is not suitable for visualizing advanced dependency relationships, or dependencies that span across tasks in different projects or other groupings.
Jira Timeline
The Jira Timeline view is included in Jira Free and Standard plans and you can use it to visualize very basic dependencies.
Here are the key things to consider when using Jira’s basic timeline view to visualize dependencies:
- You can only visualize a single project – no cross-project dependencies
- Nothing below epics can be shown (no tasks or subtasks and their dependencies)
- Only “blocked” and “blocked by” issue links can be visualized
- Cannot be shared with stakeholders who don’t have a Jira license
- Cannot display milestones
Visor
Visor’s Gantt chart view provides a more comprehensive and flexible way to visualize your Jira projects, groups of projects, and all their dependencies (issue links).
Here are the key things to consider when using Visor to visualize dependencies in your Jira projects:
- You can visualize dependencies across projects, teams, and other groups
- You can visualize all issue link types (not just blocks/blocked by)
- You can filter which issue link types you want to see and show
- Set Jira issues as milestones to create dependencies between milestones
- You can filter to just show issues you’ve classed as milestones and their dependencies
- Can be used with any Jira plan (including Jira Free)
- You can share real-time views of your Gantt chart with stakeholders who don’t have Jira licenses
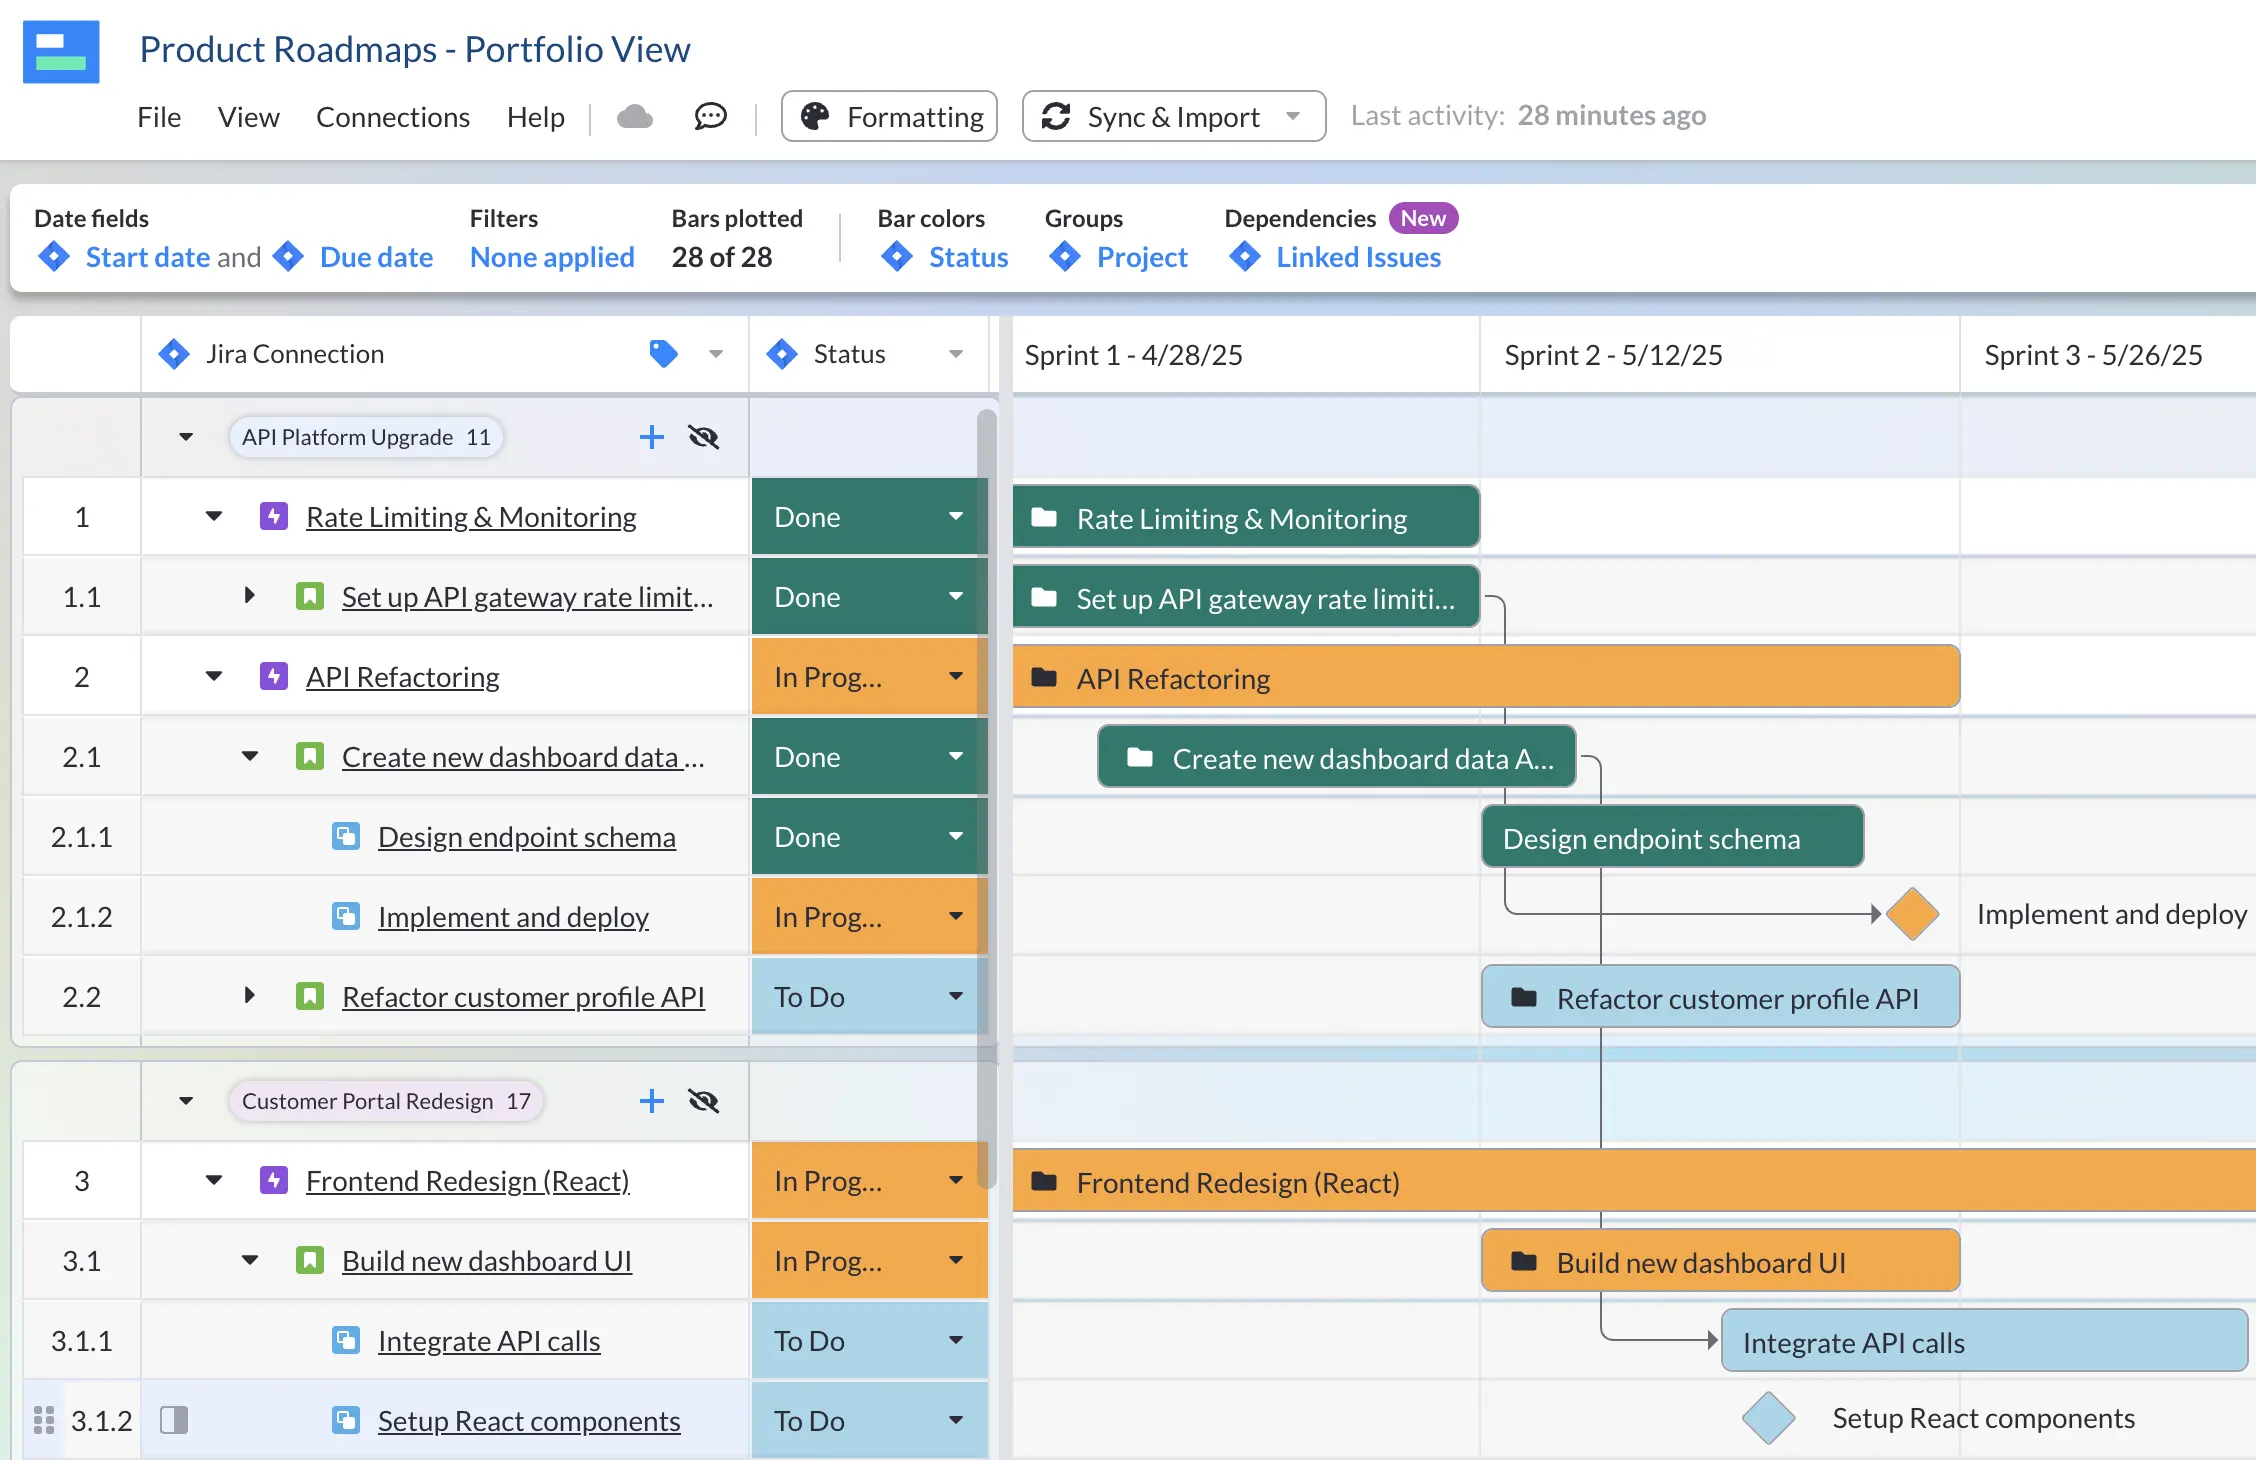
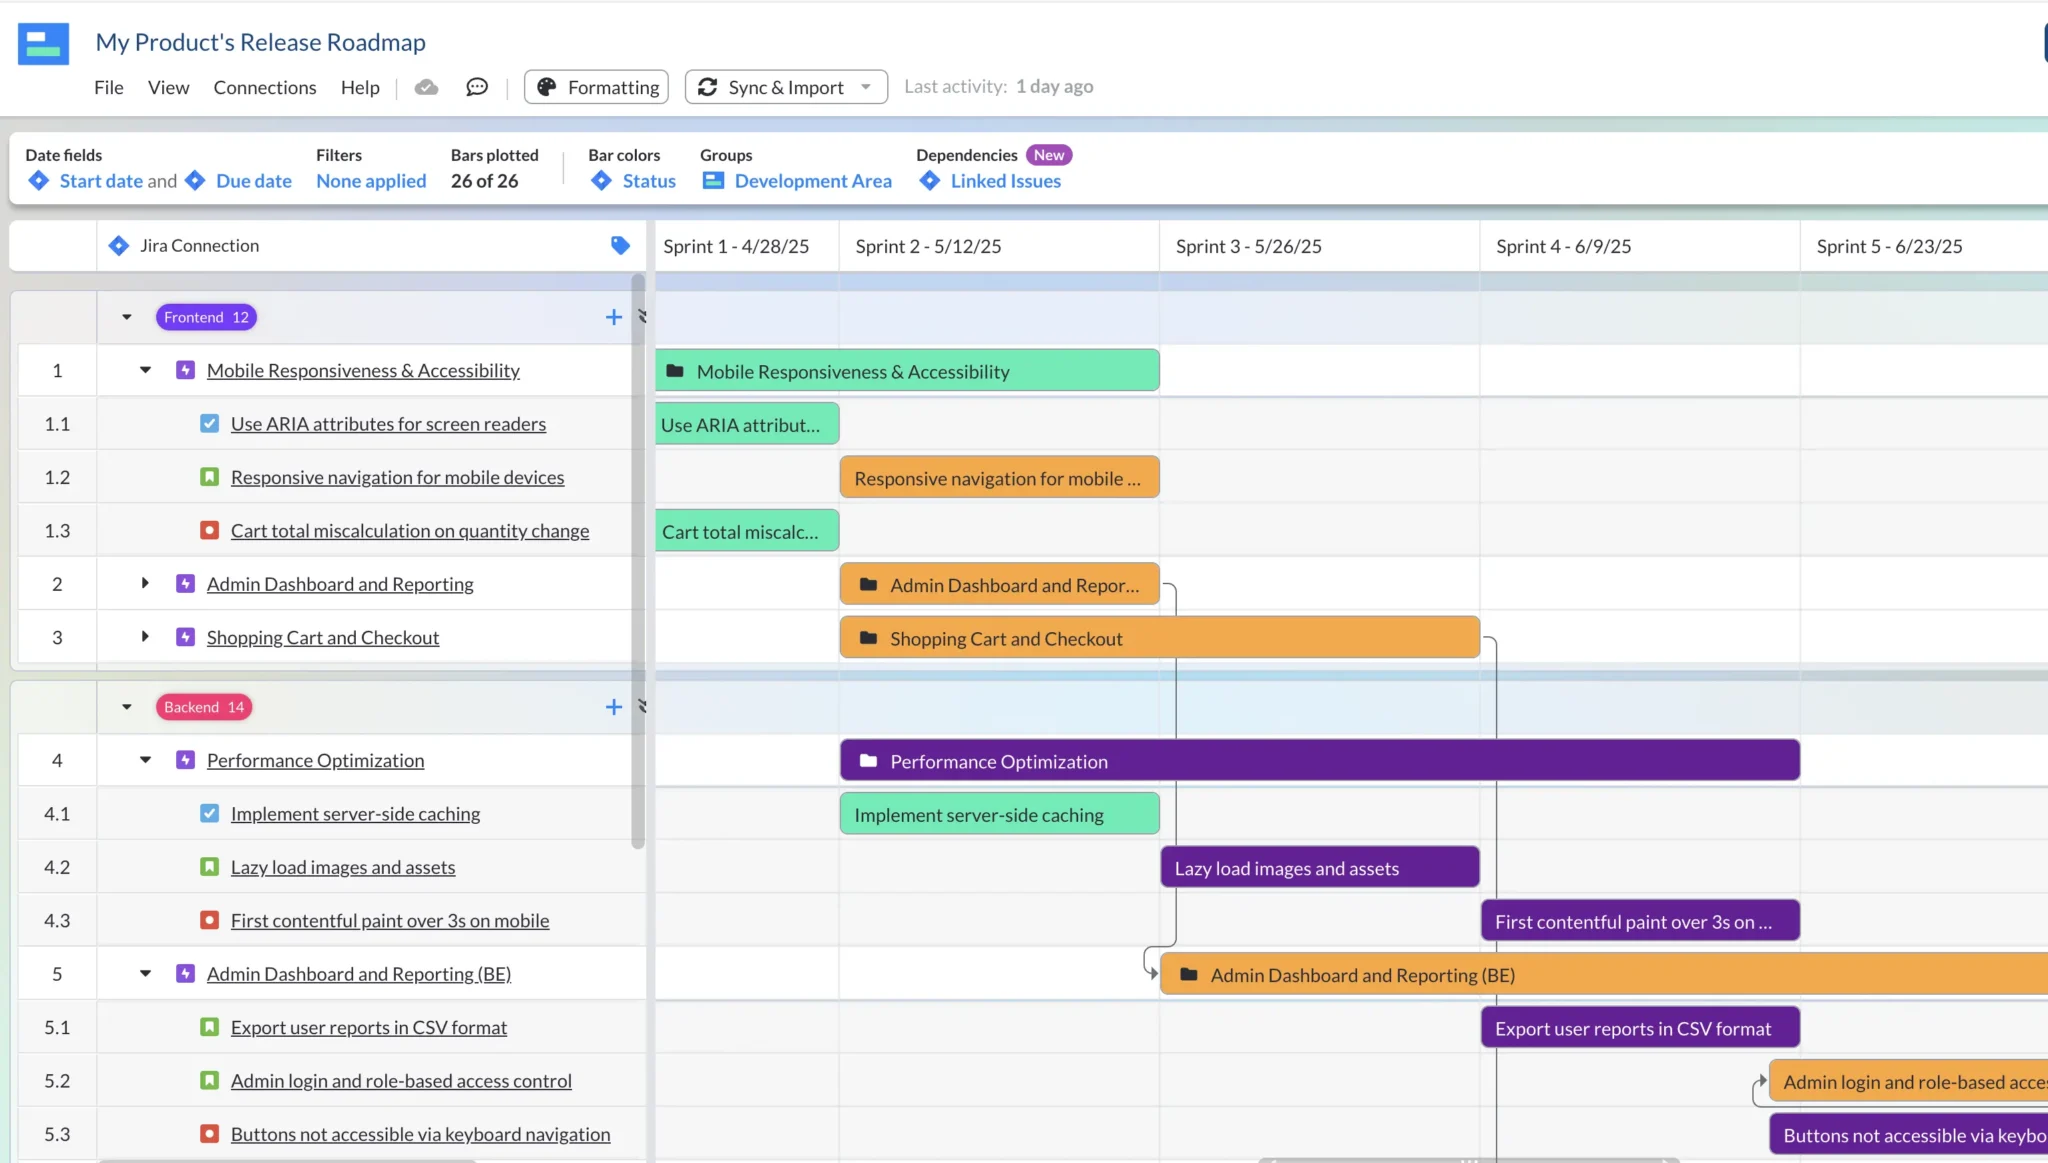
Jira Gantt Chart in Visor with dependencies (across multiple projects):
Watch the video below for more info on how to use Jira dependencies (aka linked issues) in Visor:
Jira Gantt Charts With Dependencies – Your Options In a Comparison Table:
| Jira Timeline | Jira Plans/Advanced Roadmaps | Visor | |
| Visualize multiple projects | X | ✔ | |
| Display cross-project issue links | X | X | ✔ |
| Display issue links across Gantt groupings/swimlanes | X | X | ✔ |
| Show/hide issue links by type | X | X | ✔ |
| Visualize all issue link types | X | X | ✔ |
| View milestones & dependencies | X | X | ✔ |
| Share with stakeholders outside of Jira | X | X | ✔ |
| Can be used in/with Jira Free | ✔ | X | ✔ |
| Can be used in/with Jira Standard | ✔ | X | ✔ |
Adding Summary/Rollup Calculations To Jira Gantt Charts
Sometimes you need to show informative data points on your Gantt chart in columns adjacent to the Gantt bars, for example for each task or other issue type you might want to show:
- Number of story points
- Start Date
- Due Date
- Days taken to complete
- Days before due date
- Assignee
- Status
- RAG Status
- Priority
- Percentage complete
What Are Rollup Calculations?
Like most project management systems Jira has a hierarchy of tasks (by default you have epics at level 1, followed by stories at level 0, and subtasks at level -1). Each level is a parent of the level below, meaning an epic is a parent of a story and subtask. This approach helps you break work down into smaller chunks.
Rollup calculations calculate all the values of a parent issue’s child issues.
For example, you could use a rollup calculation to show the total number of story points for an epic, based on the number of story points its child stories have. If an epic has four child stories, each with three story points, then the rollup calculation would tell you the total story points for that epic is 12.
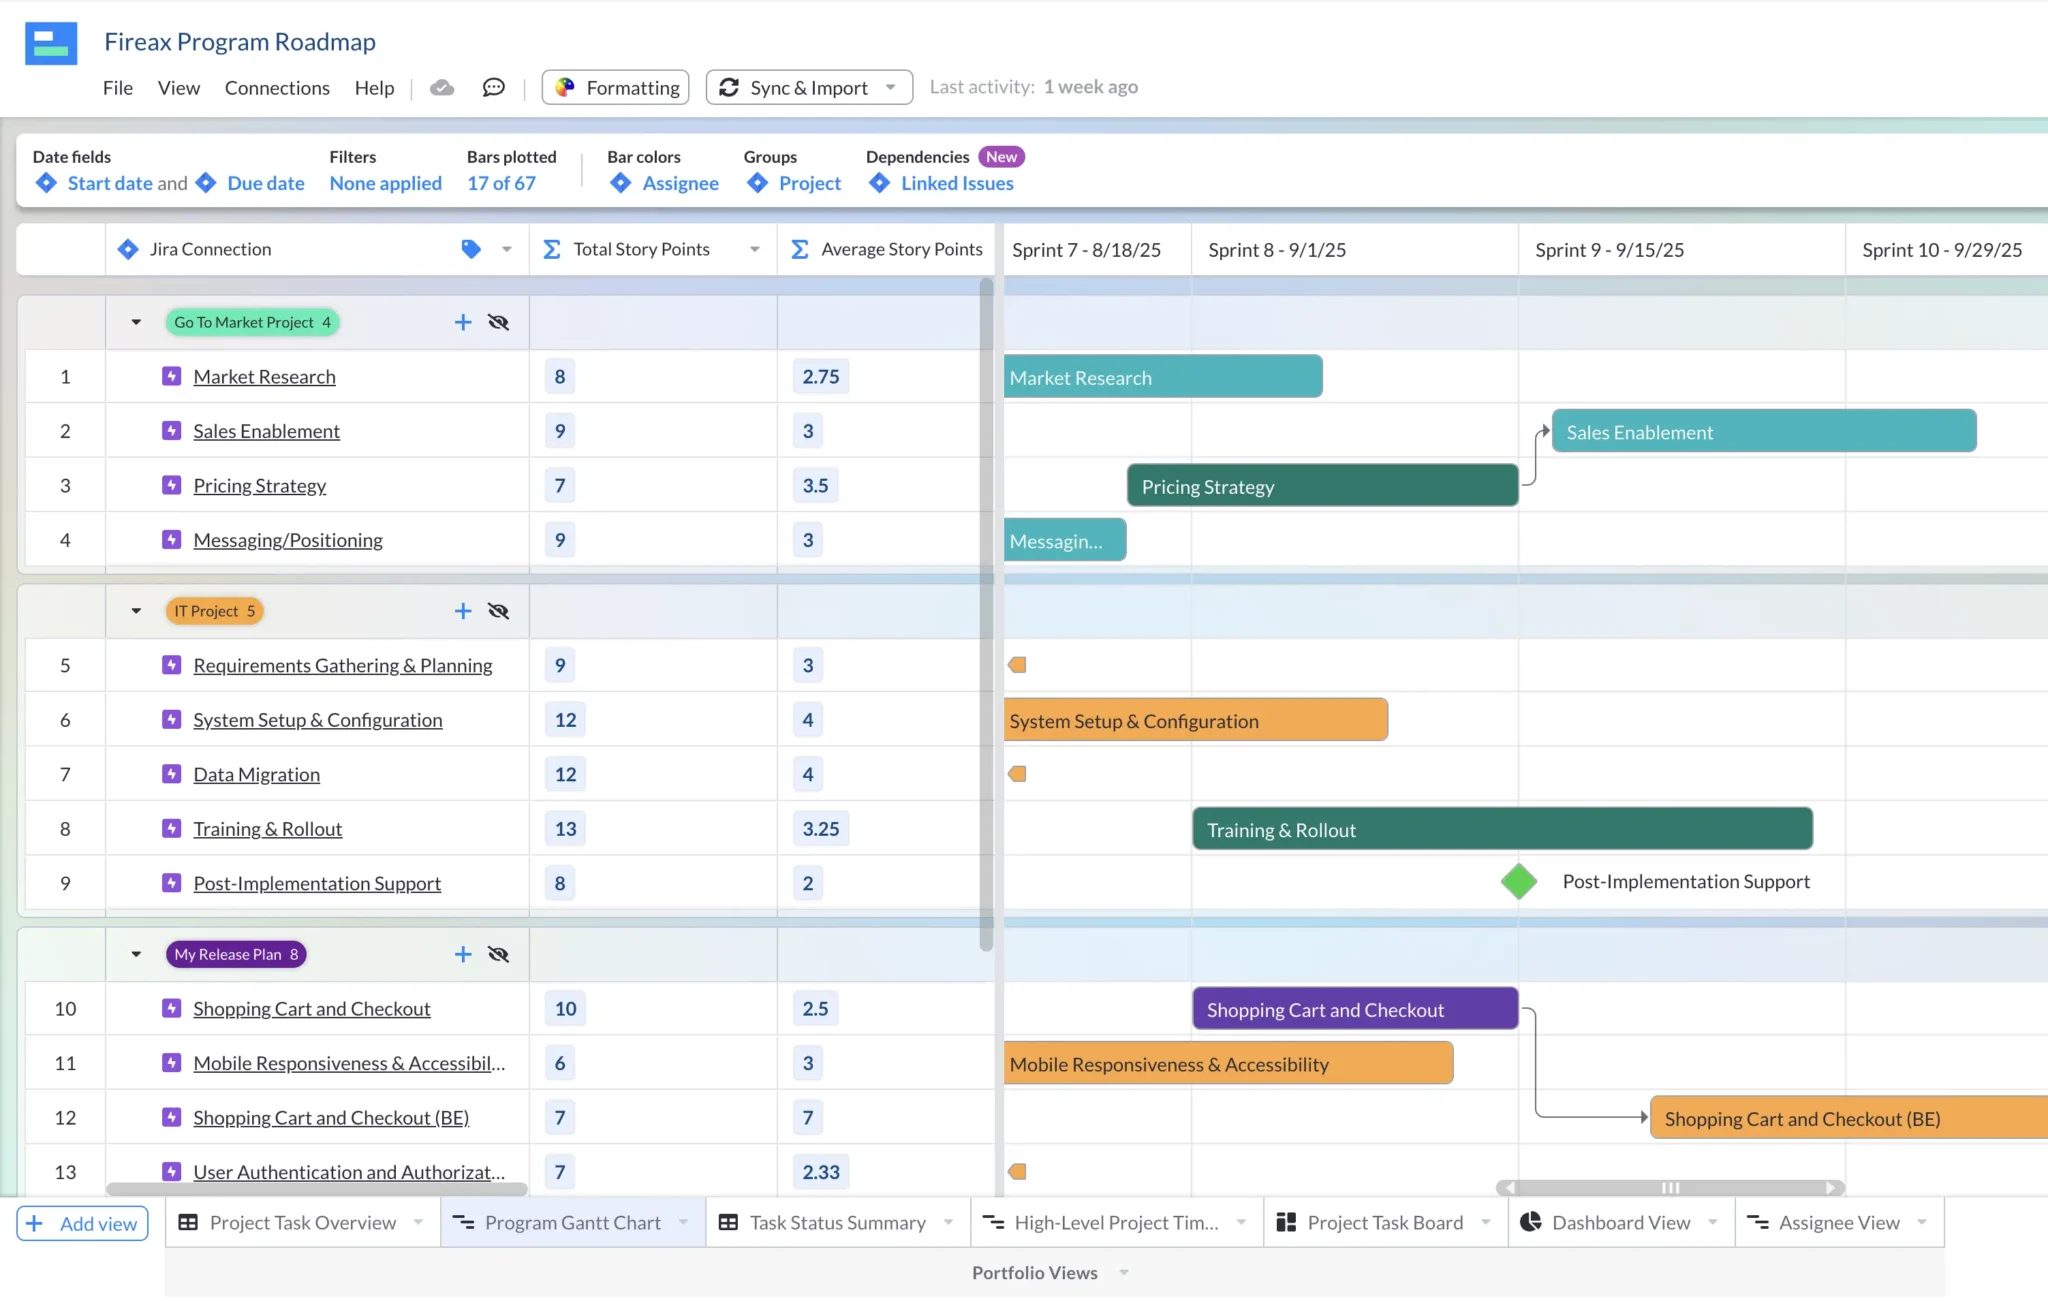
Example of a Visor Gantt chart using real-time Jira data, showing the epic level only, with two rollup calculations that calculate the total story points per epic and average story points per epic:
Why You Need To Use Rollup Calculations in Your Jira Gantt Charts
Without rollup calculations in your Gantt chart (or other view types) you will be endlessly calculating values manually to understand crucial information about parent issues and your project as a whole.
For example, there are many instances where it is necessary to know the:
- Total number of hours assigned to all stories and subtasks within an epic
- Earliest Start Date of the stories and tasks within an epic
- Latest Due Date of the stories and tasks within an epic
- Total spend per epic
- Average number of hours to complete a story within an epic
The exact calculations used will depend upon each project and context, but the examples below should illustrate how rollup calculations will help you understand your projects clearer and more quickly, so that you can plan your projects better and track progress more easily and effectively.
What are the limitations of rollup calculations in Jira’s native Gantt chart feature (Advanced Roadmaps – also known as Jira Plans)?
Here are the main shortcomings or limitations of rollup calculations in Jira Advanced Roadmaps/Jira Plans:
- Can’t Be Used On Custom Fields: Rollup calculations can only be applied to a specific set of fields, which is a really frustrating limitation for many Jira users.
- Rollups Can’t Overwrite Existing Values: If your epic already has a value, rollup calculations can’t be used to automatically set/overwrite it.
- Date Field Restrictions: Rollup calculations can only be applied to the date field you use for scheduling on your Gantt chart. You can’t use rollup calculations on secondary date fields such as planned start date, review date, approval date, resolution date, target launch date and so on.
- Can’t Rollup Multiple Hierarchy Levels: For example, values can only be rolled up to the immediate parent, for example, you cannot summarize an epic’s total number of hours allocated to all its stories and subtasks, only its stories
How To Overcome Some of Jira Advanced Roadmaps/Plans Rollup Calculation Limitations
To get full flexibility and unlock the full range of rollup calculation functionality for your Jira projects and plans you should use an app like Visor.
Unlike Jira’s native Gantt options, Visor allows you to create rollup calculation fields for any date or number field, with any of these operators:
- Sum
- Average
- Minimum
- Maximum
- Median
- Earliest
- Latest
Apply Rollup Calculations To Multiple Jira Date Fields
In Visor you can rollup multiple date fields in the same Gantt chart, giving you far greater insights into your Jira project’s progression and performance.
Rollup Through Multiple Hierarchy Levels
In Visor you can rollup values though multiple hierarchy levels, right from the bottom of the lowest child issue, up to the overall parent issue.
For example you can add a rollup field that calculates the total number of hours for an epic, based on all it’s child issues (for example stories and subtasks). This isn’t possible in Jira Plans/Advanced Roadmaps. You can apply this setting as you choose, so you control exactly how each rollup field behaves.
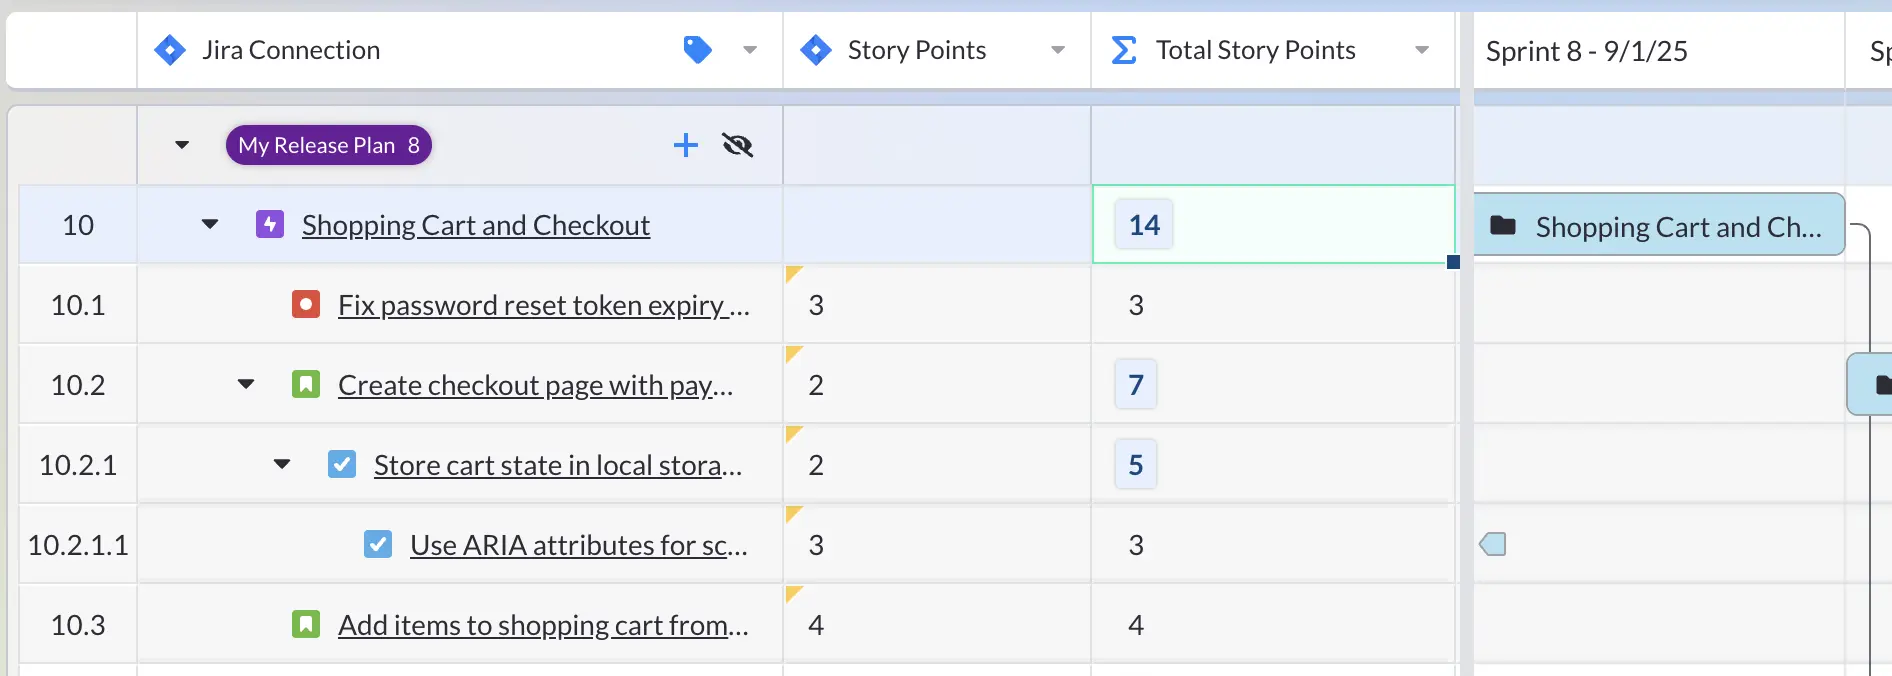
The image below shows an example of a Jira Story Point rollup field in Visor, which calculates all the story points in each epic, including those issues that are multiple steps down the hierarchy:
Being able to calculate through multiple hierarchy levels gives you the ability to instantly view the full picture at a high-level details for your project, more easily, and with greater accuracy.
Gantt Charts in Jira – Summary
Transforming your Jira data into a Gantt chart drives clarity and efficiency while making stakeholders happy. With Visor, you can quickly use your Jira data to create different Gantt views for different audiences.
If you need a high-level look at your projects, Visor is one of the best portfolio management software programs for Jira. In addition, if you need to drill down into the weeds in a Gantt chart that uses just one Jira project (or many), you can do that also in Visor.
Whether you choose to use Jira’s Advanced Roadmaps feature, their Timeline feature, or Visor’s free Jira Gantt chart functionality, we hope you leave this post knowing how to start making a Gantt chart you’ll be proud to share because visualizing your project plans in a Gantt is always a wise move.
Whether you want a more strategy roadmap or a detailed Gantt chart, Visor rivals the built-in features in Jira. See for yourself in this overview.
You can also use Visor to create Gantt charts using data from other apps (for example your Asana project/portfolio data), and embed these Gantt charts in Confluence and other apps. The Visor Gantt charts you embed in apps like Confluence or Notion stay updated with real-time data from your apps like Jira, so you can complement presentations, documents, webpages, and other resources with real-time trackers for your project, program, or portfolio.