View Settings: Instantly Understand Your Workbook Data

Start using Visor today
- Visualize all your projects and data

- Roll up multiple projects into portfolio views
- Try Visor for FREE
Our new feature, View Settings, provides a snapshot of the exact data that’s driving your Visor Workbooks.
Instantly get a summary of what data powers your Table, Timeline, and Gantt views and provide stakeholders with information about the level of detail your Custom Views display.
In this post, we’ll cover:
- Where to find the View Settings
- Types of items you’ll see in View Settings
- How View Settings improve sharing in Visor
Let’s take a look at what you’ll find in the View Settings the next time you log into Visor.
Where to Find Visor’s View Settings
When you open a workbook in Visor, you’ll find the View Settings in the Table, Timeline, and Gantt Views.
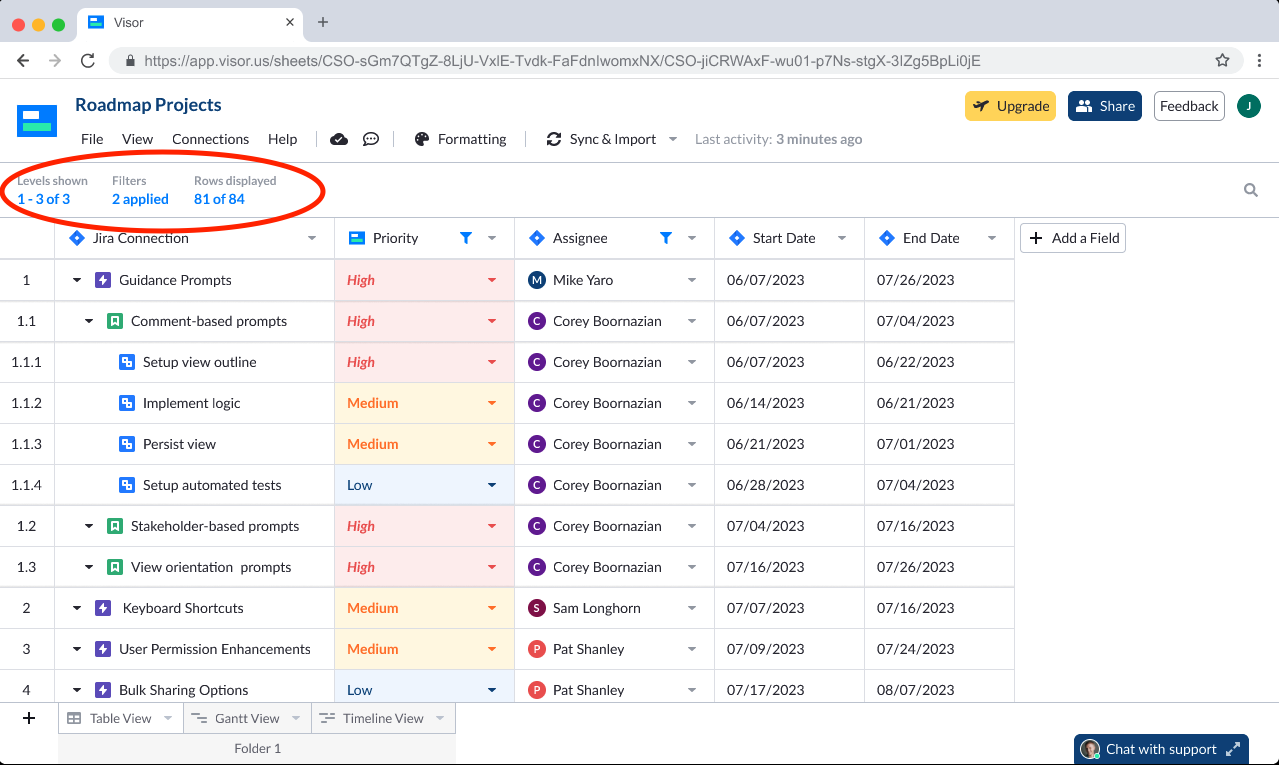
Look under the navigation bar to find it. The View Settings area gives you instant visibility into the information populating a particular View in your workbook.

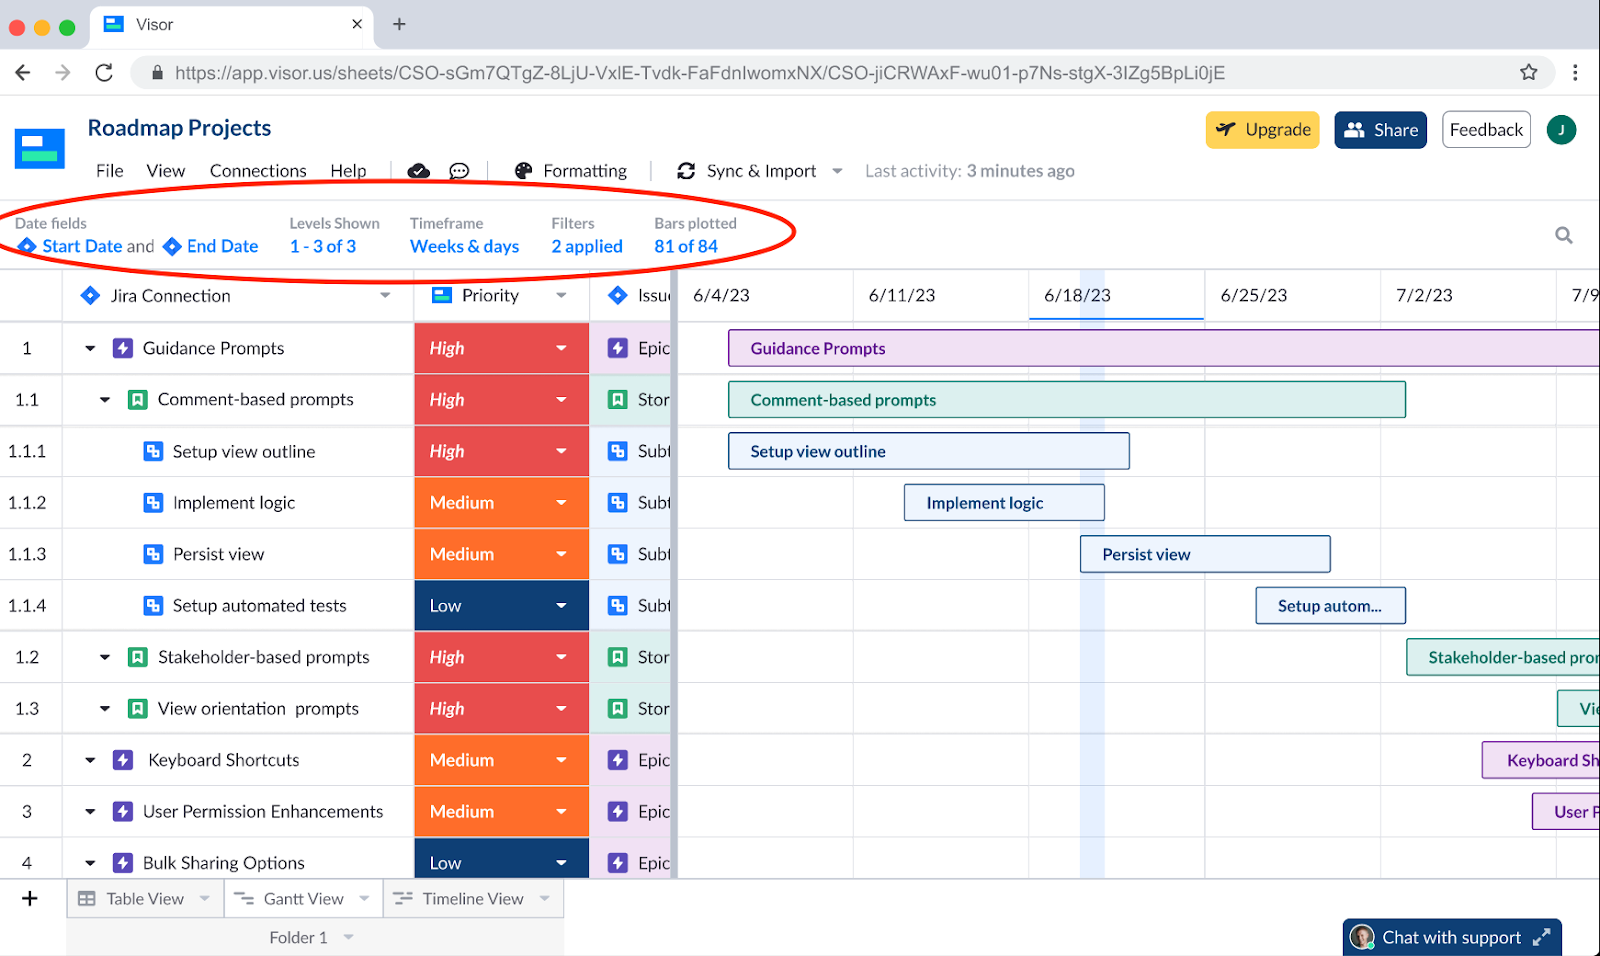
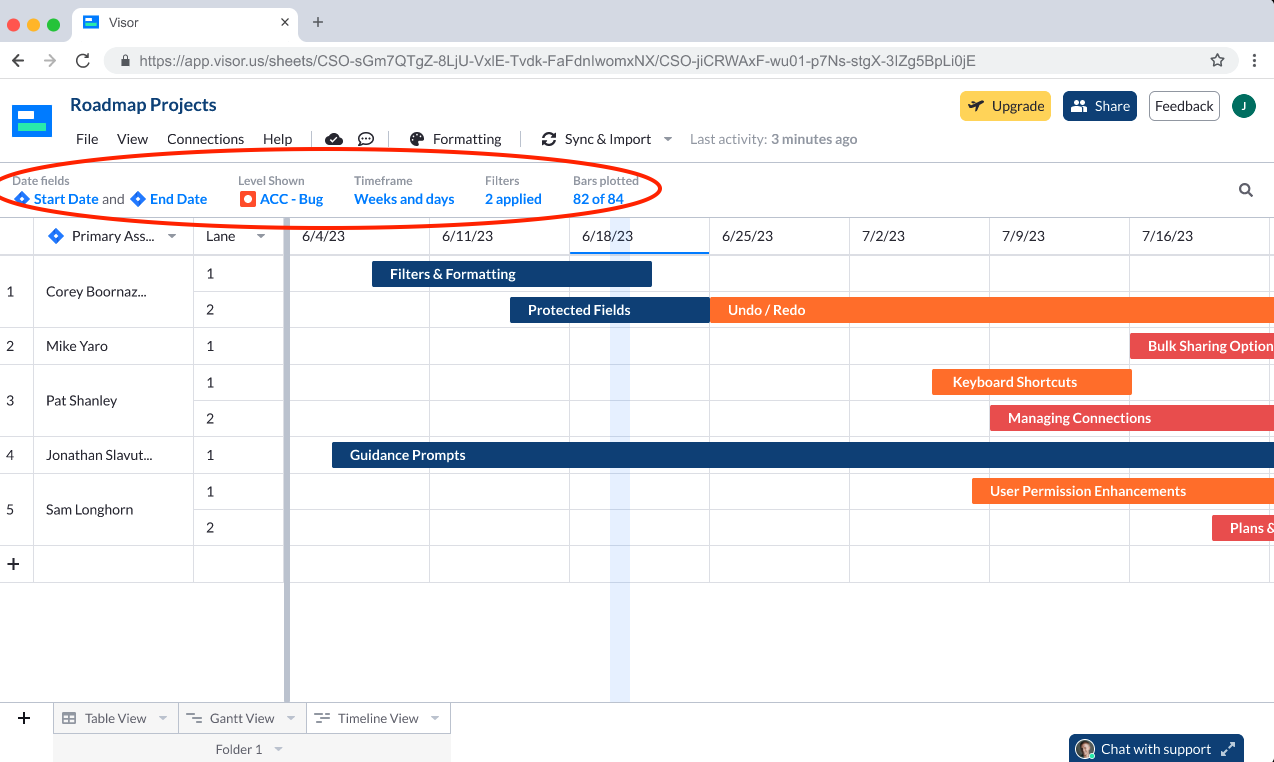
[Caption] The circled area highlights where to find your View Settings in a Gantt View. You’ll also see a handy new search bar that offers you a more convenient way to search.
Types of Information Displayed in View Settings
Visor allows you to securely integrate your project data from a connected app like Jira. The data that populates View Settings on Visor’s Table, Gantt, and Timeline Views updates automatically as you customize your project data. Here’s what you’ll see in View Settings for each View.
- In the Table View, View Settings shows the number of levels or hierarchies shown, the number of filters you’ve applied, and the number of rows displayed.
- In the Gantt View, you’ll see date fields, levels or hierarchies, the type of timeframe you selected (weeks and days, for example), filters and bars plotted.
- On the Timeline View, you’ll also be able to see your date fields, Levels shown, the time frame, as well as filters and bars plotted.
Popular Ways to Share Project Plans Using View Settings
Once you’ve connected an app, like Jira, Visor’s bi-directional integration ensures that your project data is always accurate. With the View Settings, you can instantly see what project data is powering your Table, Gantt, and Timeline Views. You’ll be able to:
See how long it takes to complete tasks: Once you configure your project’s Date Fields, such as the start and due dates, you’ll better grasp the time it takes for a task to be completed.
Keep your existing Jira hierarchies intact: Visor also honors the parent-child relationships you have in Jira and reflects them in each of your Views. Levels Shown in the View Settings area show you which levels or hierarchies you’ve filtered. This kind of clarity allows you to zoom in on specific areas of a project and still maintain an awareness of how they fit into your broader project roadmap.
Share updates that are relevant to stakeholders: You may choose to filter your workbooks by assignees on a specific team or give an overview that your CEO quickly glances at. The Filters Applied feature allows you to create Custom Views specific to each project stakeholder you work with.
Track the amount of information you’re sharing: The Rows Displayed show the exact number of rows based on the filters you’ve put in place. As you present information to your team, you can do so with confidence knowing that you are showing information that is specifically tailored to them.
Get an overview of your project’s flow: In the Gantt and Timeline Views, the Bars Plotted option shows the number of bars driving this view. This will give you a clear overview of the project’s flow and the amount of work that needs to be done.
Visor’s new View Settings area is much more than a new feature—it’s a tool designed to empower you to transform data into meaningful, easy-to-digest formats. With this update, you’ll have a place to see which filters and other settings you’ve selected to narrow your data set.
As you work in Visor, you can feel confident knowing you are helping to empower your team and engage your stakeholders by creating stunning visualizations of your project. It’s now easier than ever to manage and interpret your data on the Table, Gantt, and Timeline Views with our new View Settings.