Your Complete Guide to Gantt Chart Milestones

Start using Visor today
- Visualize all your projects and data

- Roll up multiple projects into portfolio views
- Try Visor for FREE
In the dynamic world of project management, where timelines are tight and tasks are plentiful, it takes careful planning to achieve your goals. At the heart of this process lies the Gantt chart, a powerful tool that lets you visualize project timelines, tasks, and dependencies with remarkable clarity.
However, along with the bars and lines that make up a Gantt chart, there are special markers that hold the key to project success: milestones. Milestones let you identify significant achievements and other markers that indicate your project is on the right track.
In this post, we’ll help you get familiar with Gantt chart milestones and how you use them, including:
- What Gantt chart milestones are
- The difference between milestones and tasks
- Examples of when you can use milestones
- How to create Milestones using Visor
What are Gantt chart milestones?
In a Gantt chart, milestones represent significant points or events in a project timeline. These are key moments that mark the completion of a significant phase of work or the achievement of an important goal.
These milestones help project managers and team members track progress, communicate key achievements, and ensure that the project stays on schedule. They serve as important reference points for evaluating project performance and making necessary adjustments to keep the project moving forward effectively.
The difficulty is not every app with Gantt chart functionality can handle milestones, or allows you to add milestones to Gantt charts easily.
For example, Jira offers the ability to make Gantt charts with their two built-in roadmap features, Jira Timeline and Advanced Roadmaps. However, both of these options don’t allow you to add milestones (despite Jira users requesting this feature for years).
In those cases, if you really want to add milestones to your Jira Gantt chart, you will need an app, like the one provided by Visor.
Visor lets you connect to data from outside sources like Jira and Asana or enter your own project data. Using an easy drag-and-drop interface, you can visualize your project plans as a Gantt chart before sharing with others.
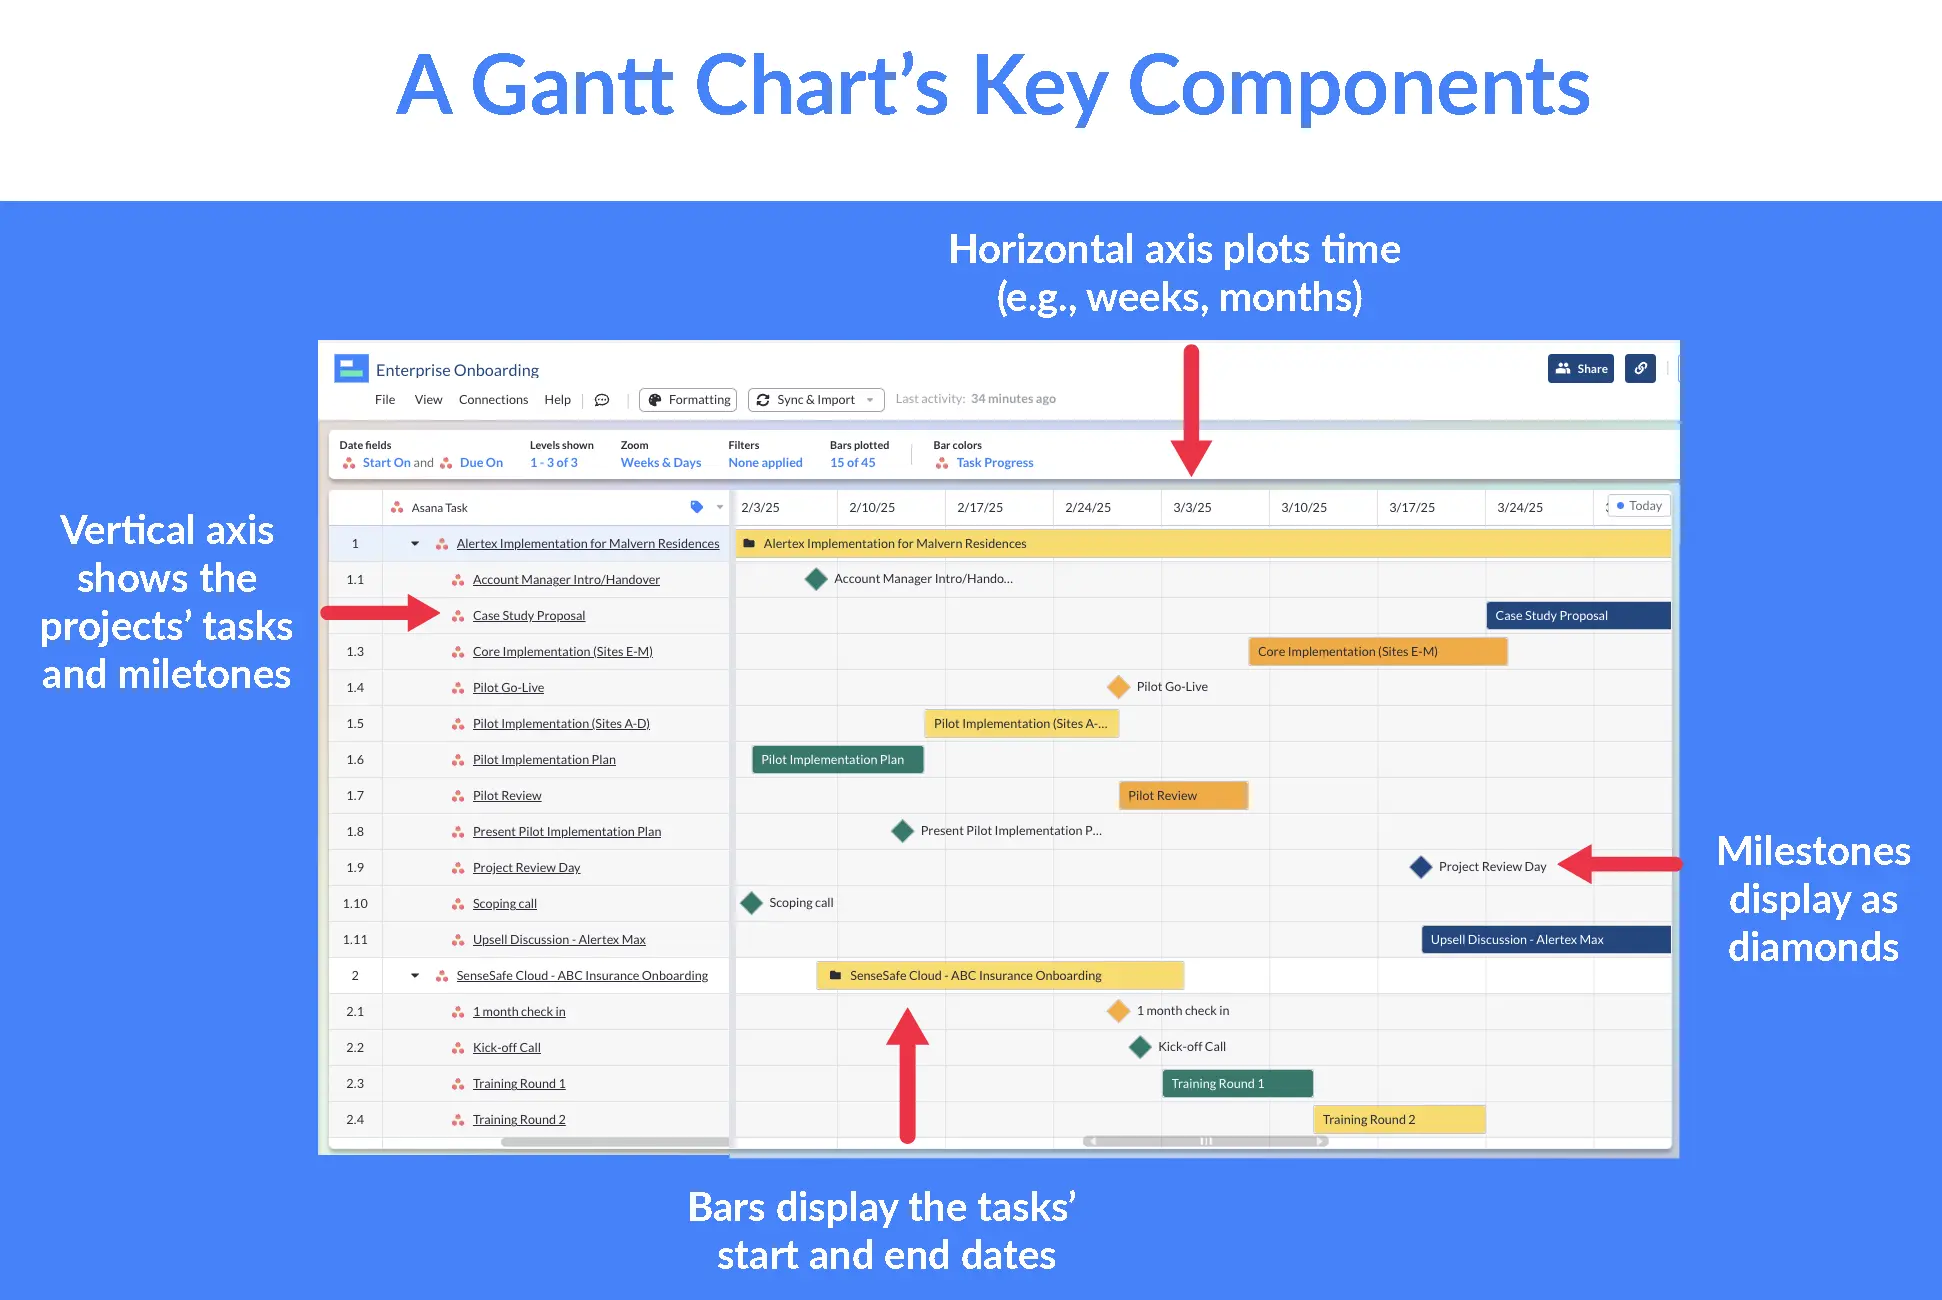
What symbols are used for milestones on a Gantt chart?
In Gantt charts, milestones are typically represented by diamond-shaped symbols along the project timeline. These diamond symbols stand out from the bars that represent tasks or activities, making it easy to identify significant points or events in the project’s progression. The use of diamond shapes helps to visually distinguish milestones from other elements in the chart, such as task durations.
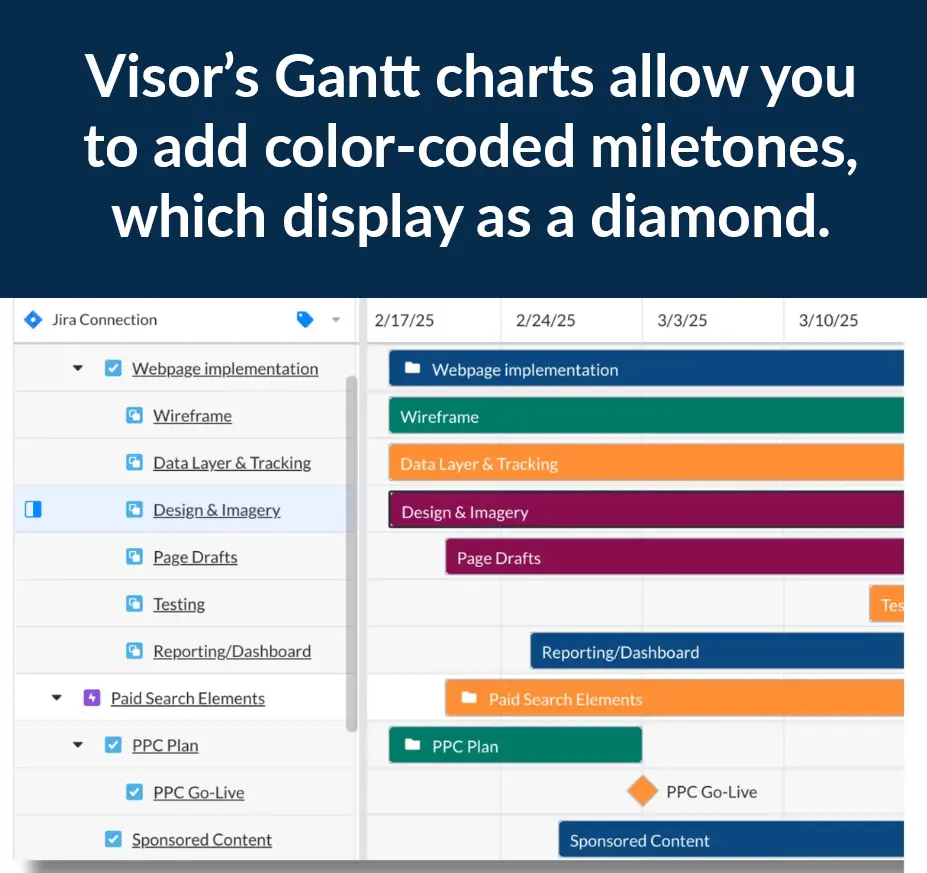
Milestones look like diamonds in Visor:
This diamond symbol indicates a milestone event, such as the completion of a key deliverable or the start of an important phase in the project. It’s a visual cue that helps project managers and team members quickly recognize critical points in the project timeline.
What’s the difference between a Gantt chart milestone and a task?
When you look at a Gantt chart, the diamond is a milestone, and the bar is the task. If you’re not sure which to label as which, here are the key differentiators:
Gantt Chart Milestone
- A milestone represents a significant event or achievement in the project.
- It marks the completion of a major phase or the attainment of a critical objective.
- Milestones do not have a duration and typically represent a single point in time.
- Milestones serve as key markers for tracking progress, highlighting important accomplishments, and signaling critical points in the project’s lifecycle.
Gantt Chart Task
- A task represents a specific activity or work effort required to complete the project.
- It is a discrete piece of work that contributes to achieving project objectives.
- Tasks can be further broken down into subtasks, with their own details.
- Tasks are actionable items that require resources, time, and effort to complete, and they contribute to the overall progress of the project.
To put it simply, a milestone is a one-time event. A task is work that takes time to complete. They’re both key parts of a Gantt chart, and should both be available in the tool you’ve chosen to create your chart.
If you don’t have access to both, consider an alternate solution, like Visor, that would allow you to import your relevant data to make a Gantt chart with milestones. Visor’s project Gantt chart templates and release roadmap templates (which use our Gantt view) are great for people who need help getting started.
4 Gantt Chart Milestone Examples
So now that you know what a milestone is and what it looks like, you may be asking, when would I use it?
The basic guideline is that a milestone acts as a moment when there’s a change in the stage of a project or a critical event, usually with a specific due date. To give you some idea of what that means in practice, here are a few examples:
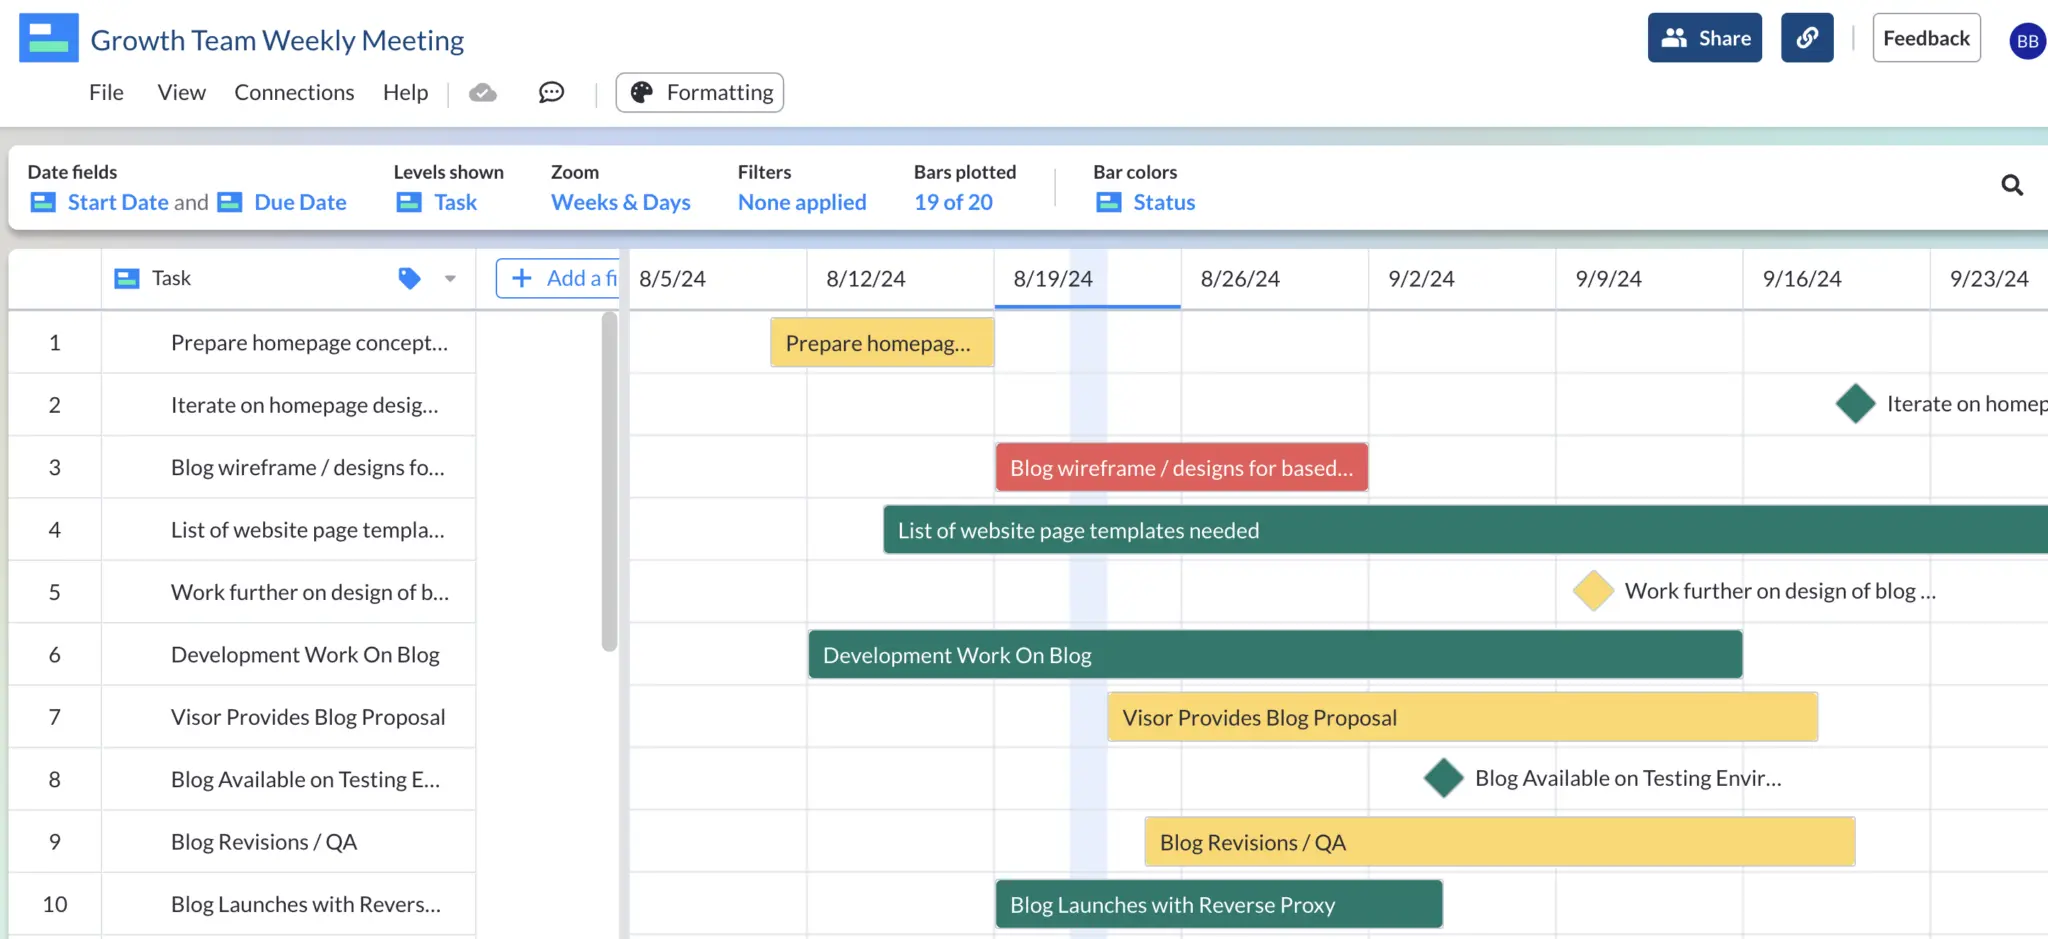
Important meetings
You might want a milestone to mark a kickoff or other key meetings throughout the life of your project, like stakeholder briefings, progress reviews, or decision-making sessions.
Visor Gantt chart with milestones used for growth team meetings:
Approvals
If you need to obtain approval for a project design, blueprint, or any other element of your project, you can mark the approval date with a milestone. This ensures that key decisions are documented and integrated into the project timeline.
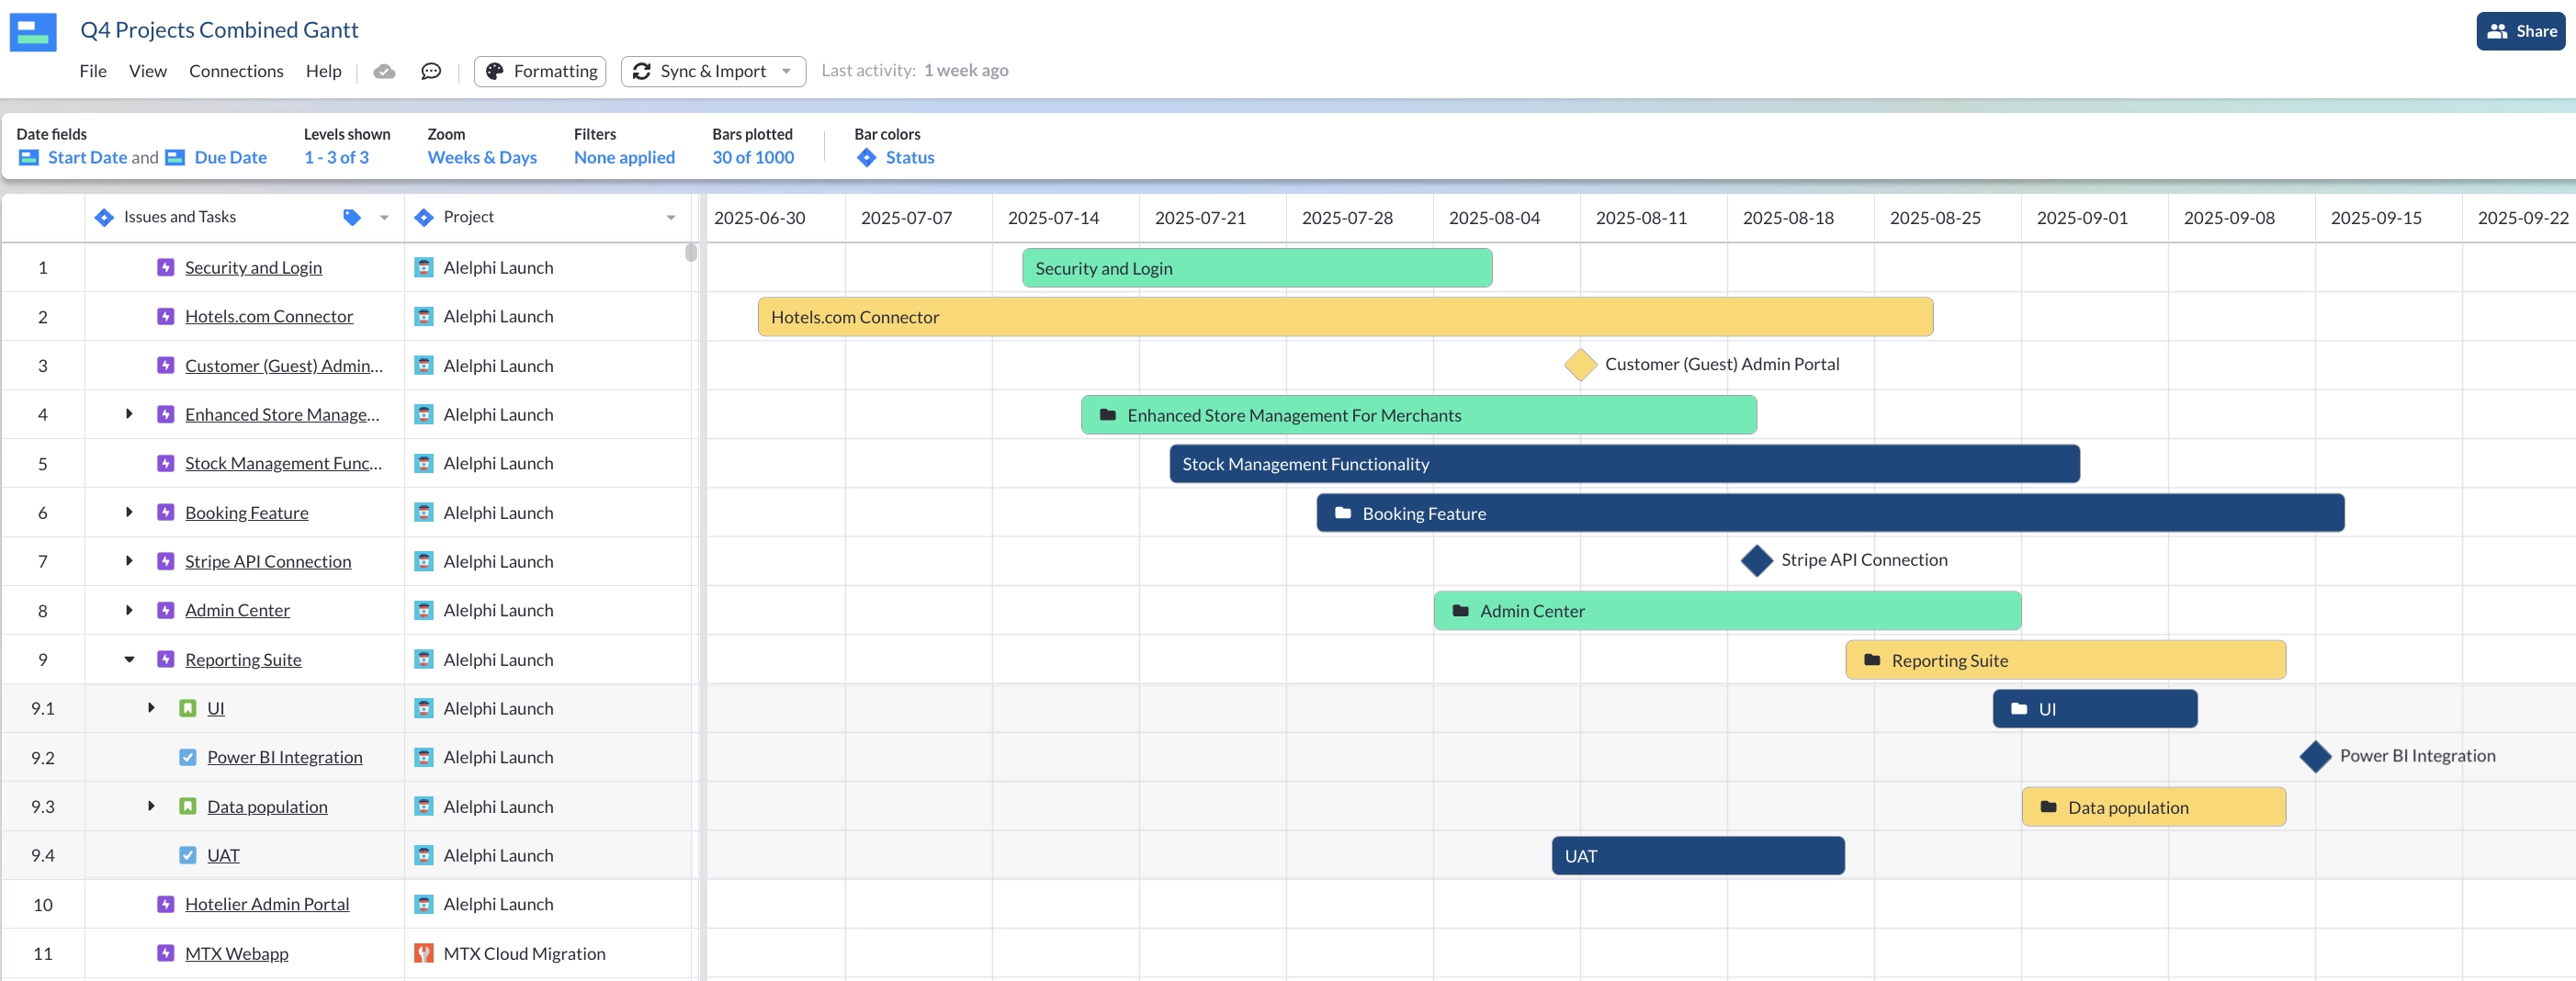
A Visor Gantt chart with Jira data. Milestones were added.
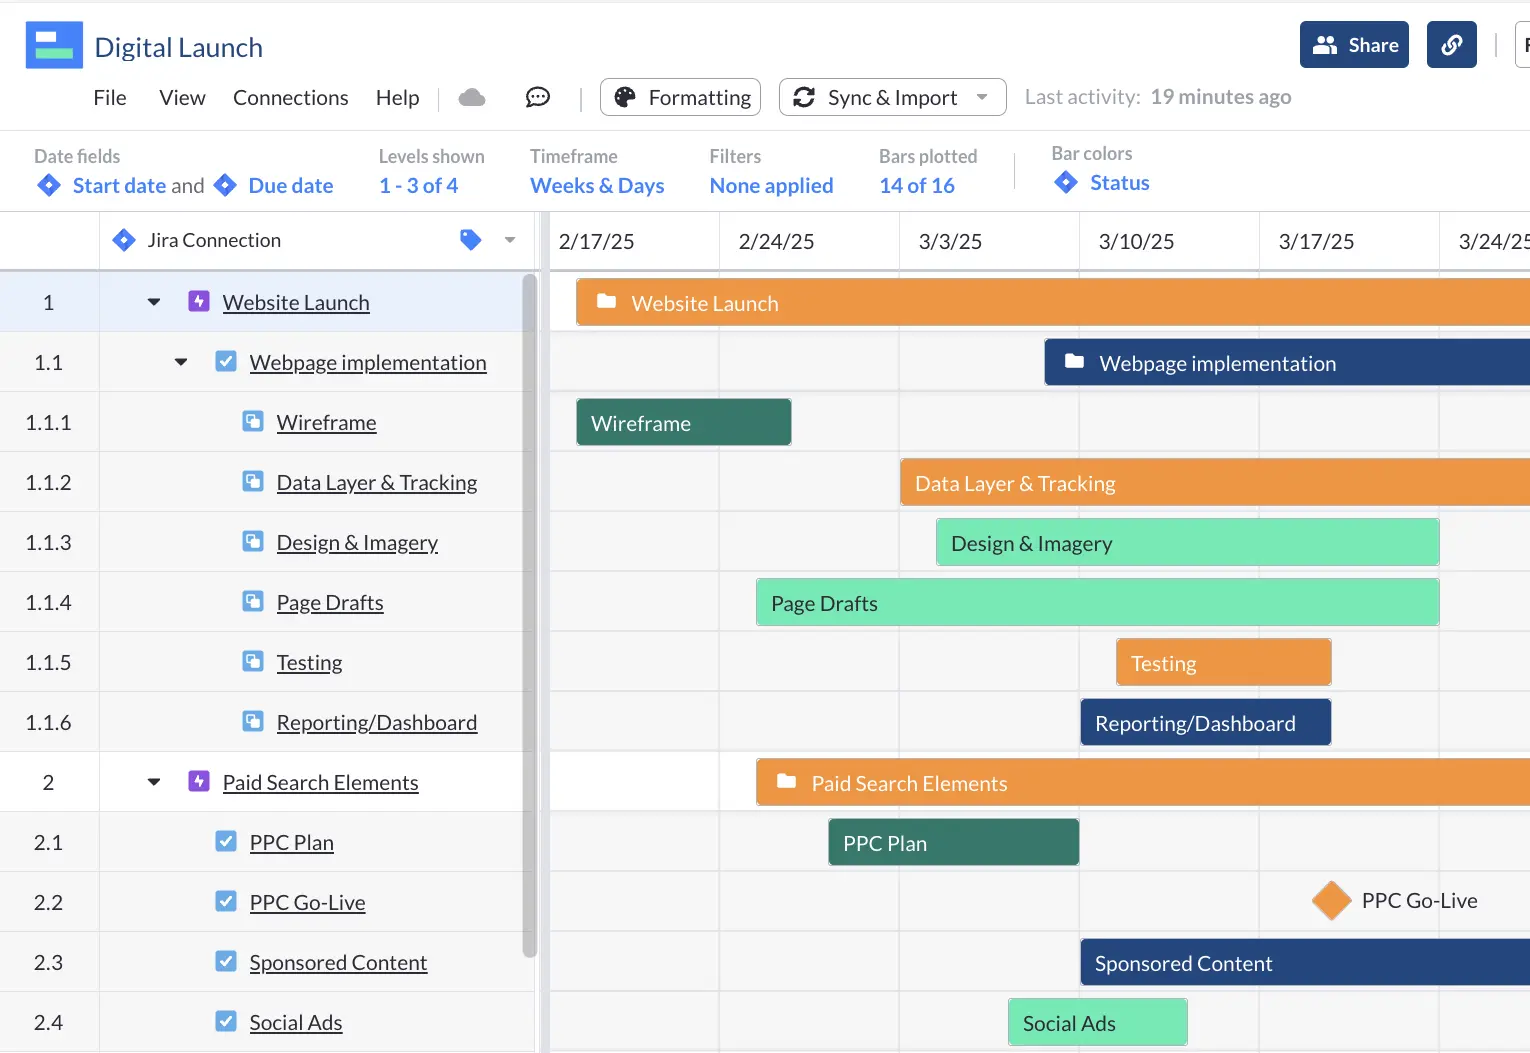
Atlassian does not offer Jira milestones. Therefore, Visor is a great way to enrich your Jira data, making your project plans more clear for other teams.
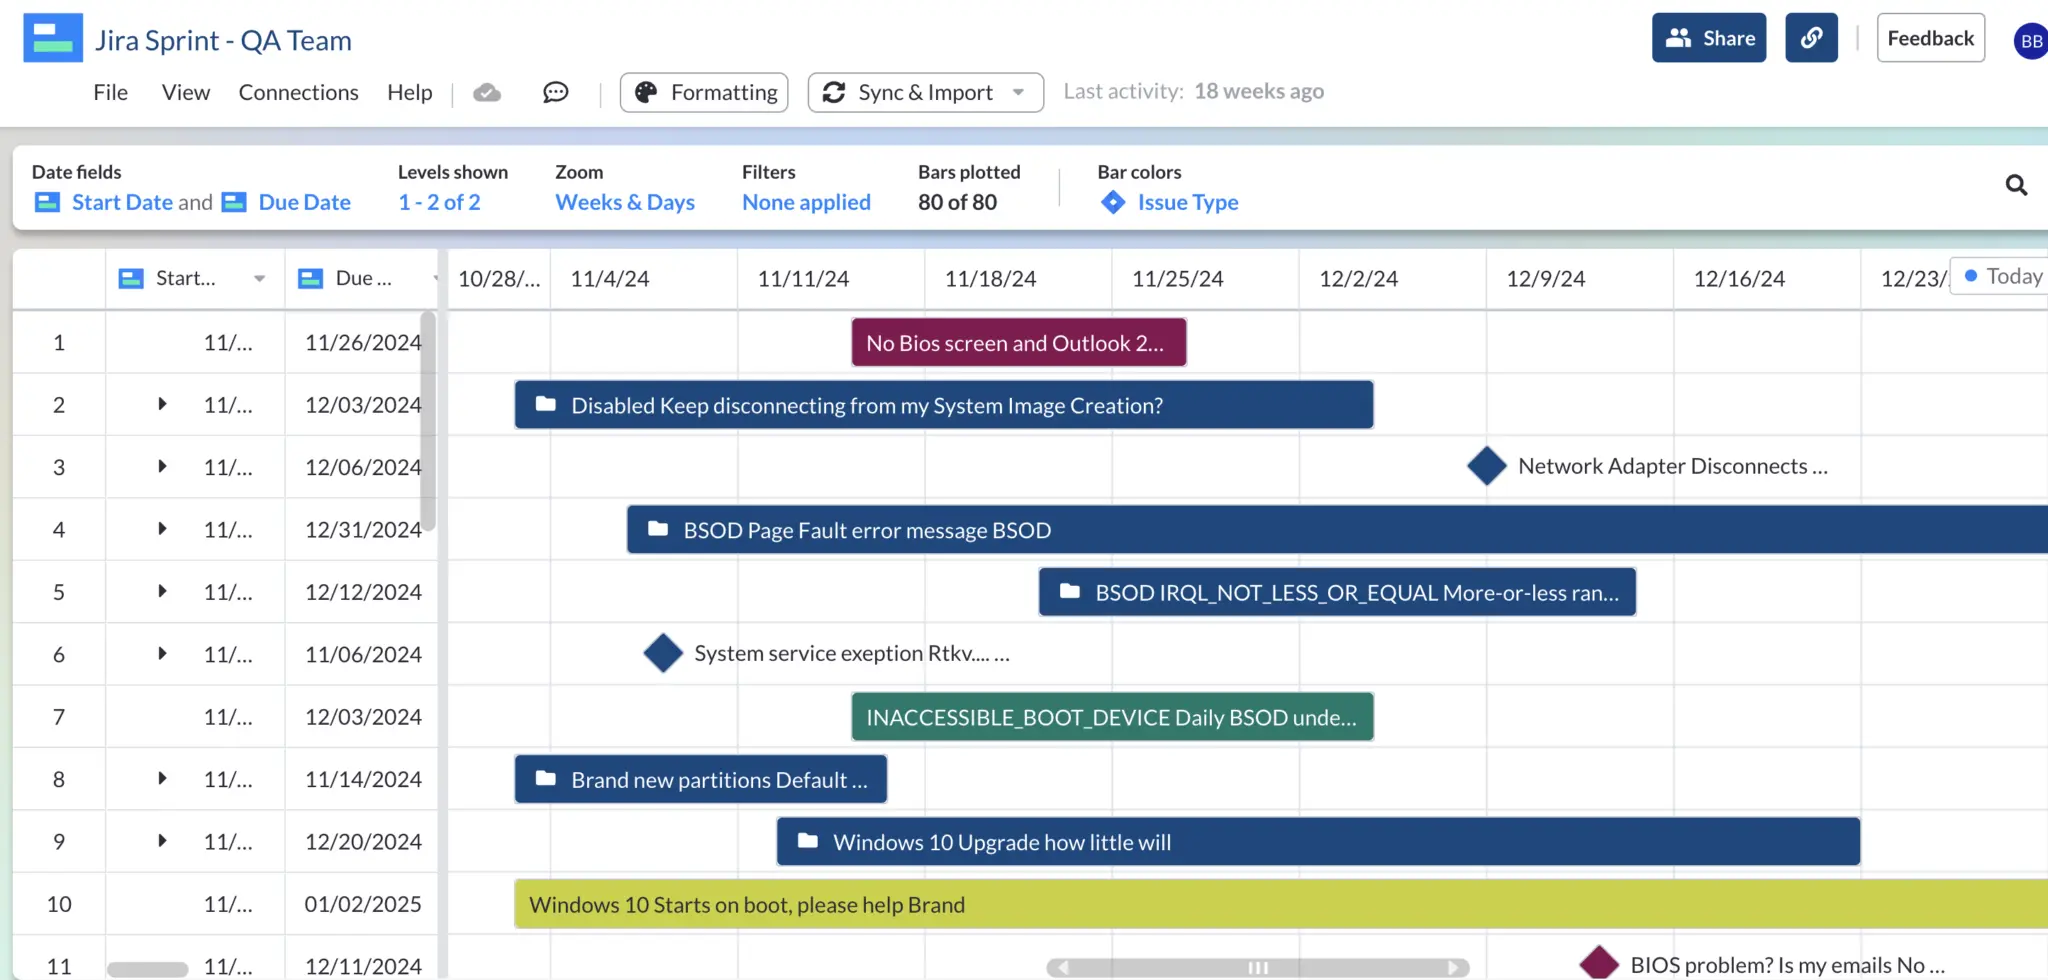
Testing
The period when you begin testing procedures to ensure quality and functionality can be marked as a milestone. This could include milestones for the start of alpha or beta testing phases, as well as the completion of testing and quality assurance activities.
QA Team’s Visor Gantt:
Completing an element of the project
You can note when a significant element of the project is completed. For example, you might have a milestone for when a prototype is finished, when training for end-users is completed, or even when the project is formally closed and handed over to the client.
By incorporating these milestones into your Gantt chart, you effectively track progress, identify critical points in the project timeline, and ensure that key events and achievements are appropriately acknowledged and managed throughout the project lifecycle.
Multi-Project Asana Gantt Chart with Milestones:
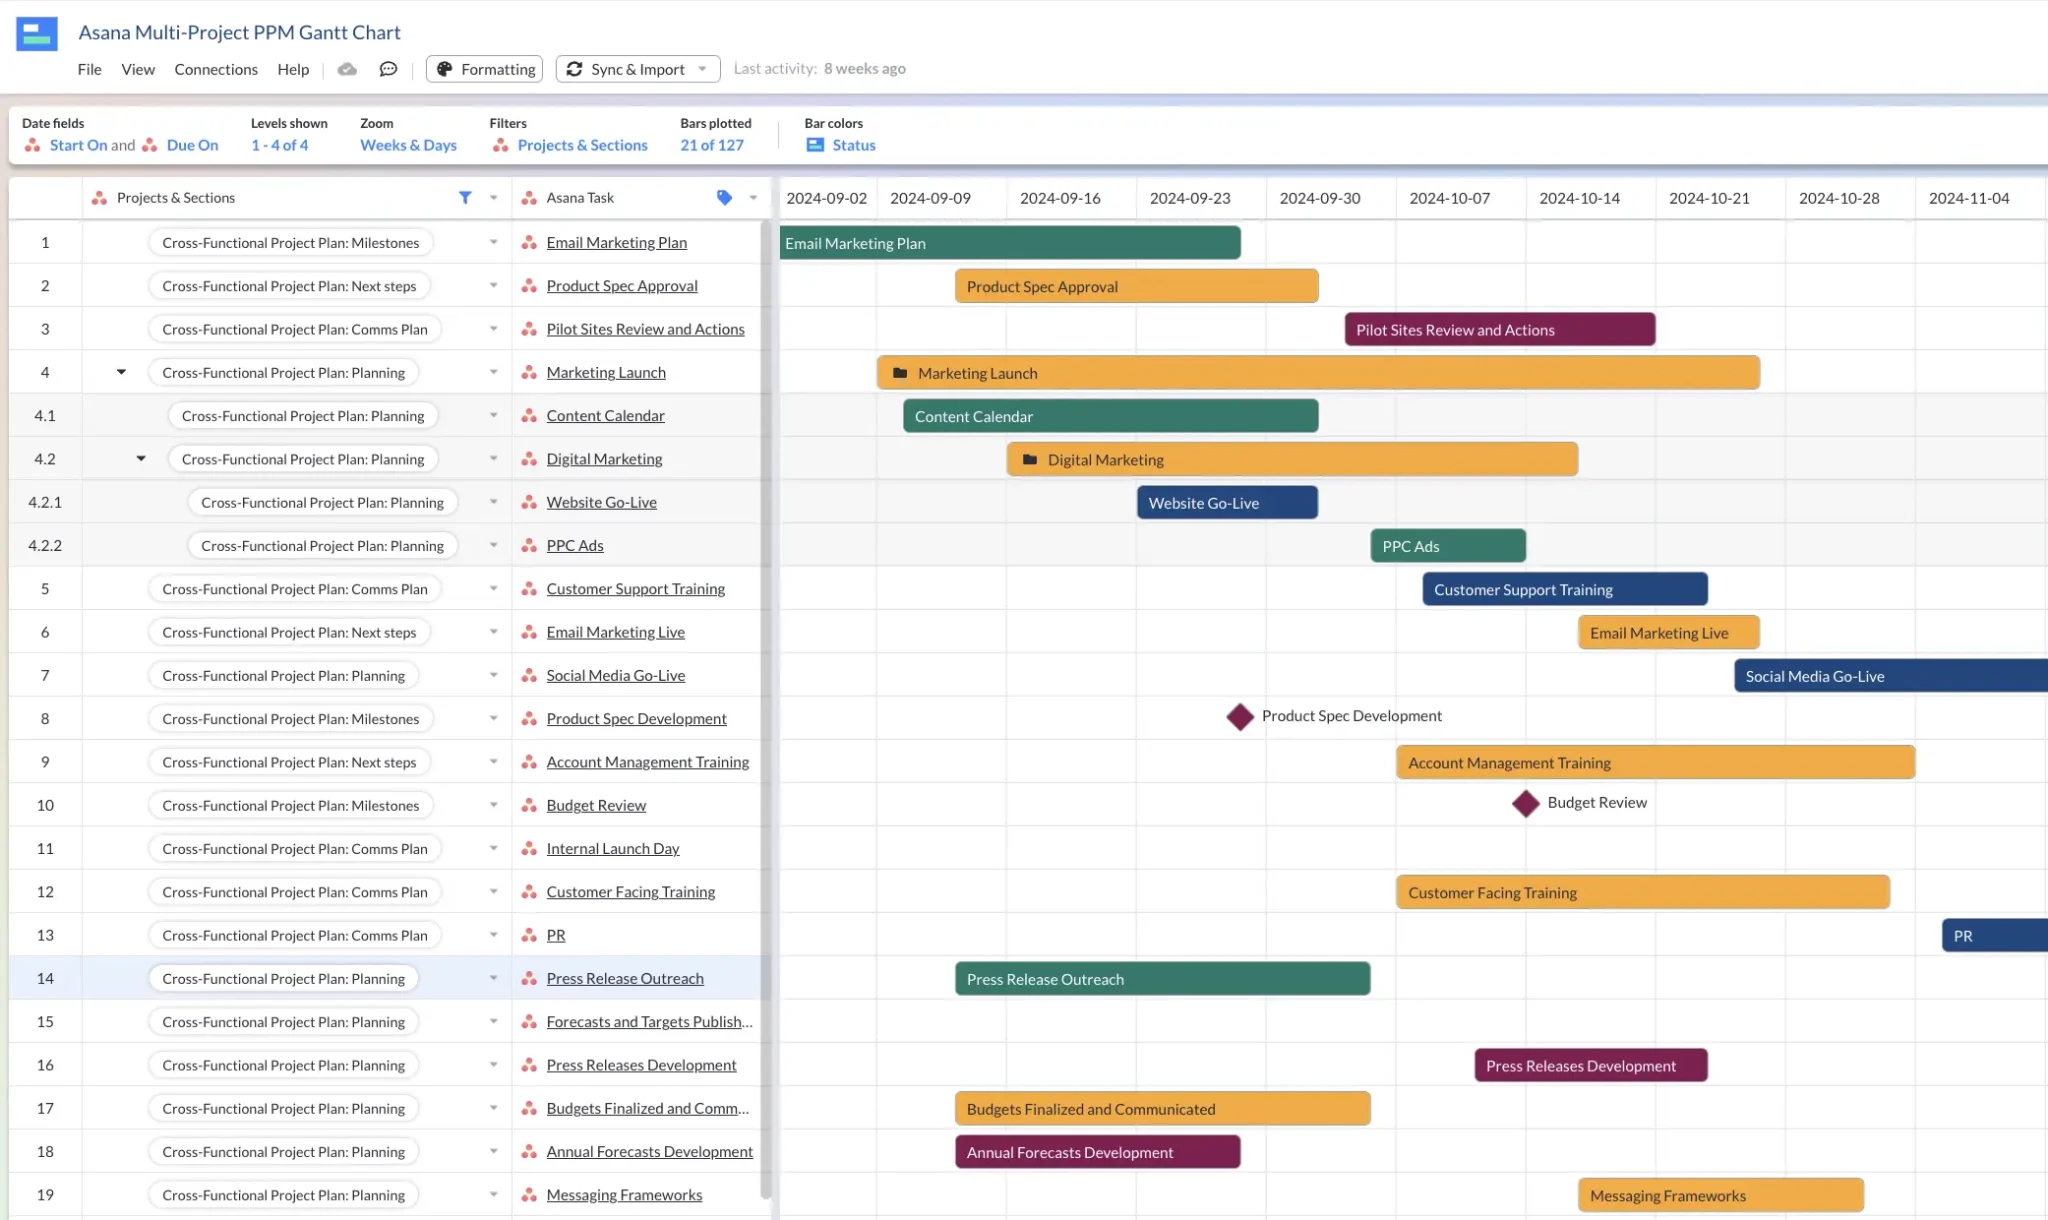
Because Asana has milestones, Visor is able to import, edit, and display Asana milestones in our Gantt view.
How many milestones should you include in a project plan?
The number of milestones you include depend on how complex your project is, how long it’s going to take, and its specific objectives.
As a general guideline, aim to include at least one milestone for each major phase of the project, along with additional milestones for critical checkpoints or key deliverables within each phase.
There’s no number that will work for every project. Just try to strike a balance between providing enough detail to track progress effectively and keeping the Gantt chart clear and easy to understand.
Why should you use Gantt chart milestones?
There are several benefits to adding milestones to your Gantt charts, including:
- They help you visualize progress: Milestones show you key events or achievements in the project timeline. They allow stakeholders to quickly assess progress and understand where the project stands in relation to important goals.
- You spot potential problems: By identifying critical points in the project’s lifecycle, milestones help you keep an eye on key tasks that have to be completed on time and ensure your project stays on track toward its objectives.
- It makes communication easier: Milestones keep team members, stakeholders, and clients focused. They provide a common reference for discussing progress, making decisions, and addressing any issues or concerns.
- They highlight achievements: Milestones celebrate significant accomplishments and milestones in the project and offer markers of progress and success throughout the project lifecycle.
- They support decision-making: Milestones provide valuable information for making informed decisions about resource allocation, risk management, and project scheduling. They help project managers prioritize tasks and allocate resources to achieve project goals.
- The can help make Agile Gantt charts: While Gantts are inherently a Waterfall method, some Agile teams make them (by choice or force). We wrote a whole article about how milestones can make Agile Gantt charts provide broader expectations, easing the friction between Agile and Waterfall methods.
Overall, Gantt chart milestones play a crucial role in effective project management by providing structure, clarity, and direction throughout the project lifecycle. They enable project teams to stay focused, aligned, and on track toward achieving project success.
How to add milestones to a Gantt chart
Depending on the tool, adding a Milestone is pretty easy. Because Milestones are not yet available in Jira, we’ll show you how to do it using Visor as an example:
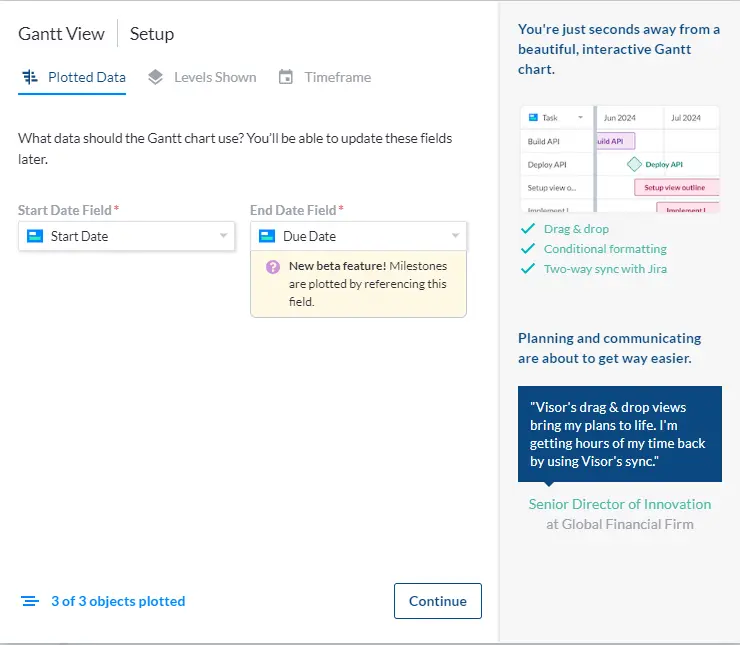
Step 1: Choose your end date
When you start a new workspace in Visor, the system will ask you a few questions. One relates to end dates. If you’re pulling data from an app like Jira, Visor will want to know which Jira field it should use for your end dates. This lets Visor know where to put Milestones on your Gantt chart.
Select your preferred field from the End Date dropdown menu (and fill in any other preferences you might have), and you’re all set.
Creating a Gantt chart in Visor:
Step 2: Create your Milestones
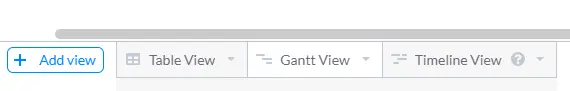
After you set up your Visor Workspace, just select Gantt View on the bottom of your screen to see your data in a Gantt chart.
View options in Visor:
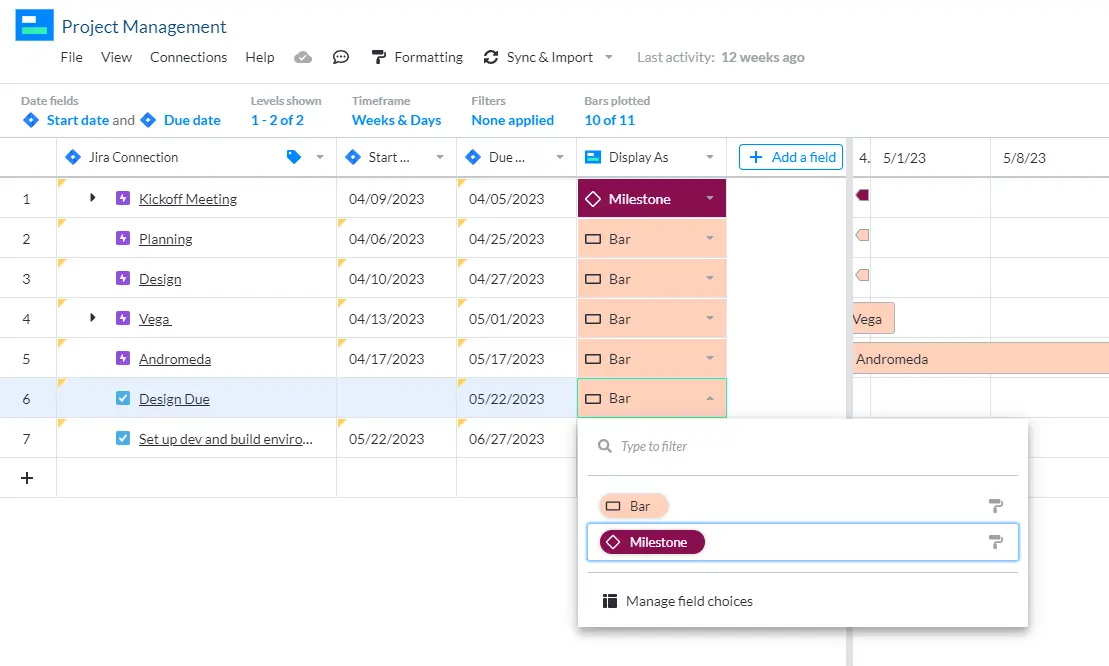
The rest is easy. To change a Bar to a Milestone, find the Display As column. Find the row you want to change to a Milestone and select the dropdown menu for that row. You’ll see the Milestone option. Select it and the row will be changed to a Milestone.
Milestones and bars in a Visor Gantt:
You can change your Milestone back to a Bar at any time. Just select Bar from the Display As dropdown menu for the record you want to switch back or right-click on a Milestone and select Display as Gantt bar.
Step 3: Customize how Milestones appear
If you want to customize the colors on your Gantt chart, you can do that too. Visor gives you the ability to set colors for elements in your Gantt chart, or to set conditional formatting, based on the kind of information attached to a task.
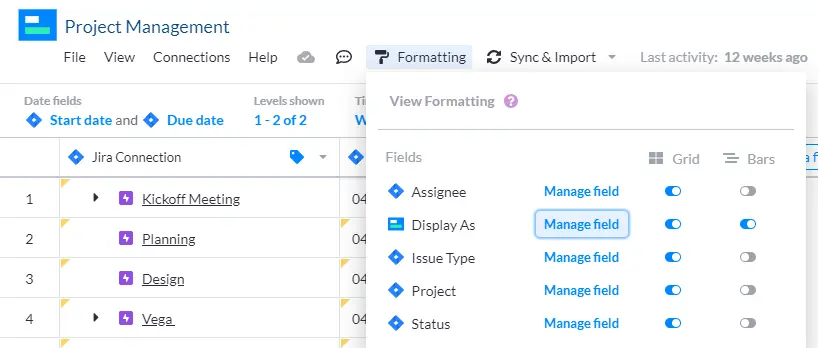
To change the color for a Milestone, select Formatting from the top left menu. Select the Display As option, then select the Bars toggle, and then Manage Field.
Display options for a Visor Gantt:
When you select Manage Field, select Format next to Milestones to view formatting options.
Color formatting a Visor Gantt:
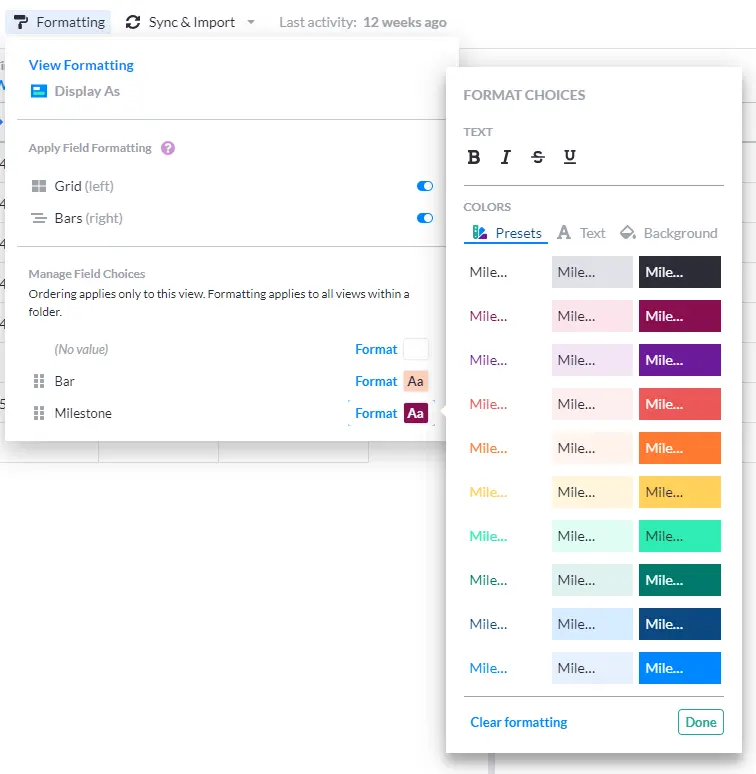
Color code your Gantt chart using the Preset colors, or select Background to enter a Hex color code.
Once you have things looking the way you want, click Done to return to the Gantt chart.
And that’s it! You’ve customized your Milestones.
Note: Be aware that while Visor does allow Milestones, not all Gantt chart-making tools do.
The necessity of Milestones in Gantt charts
Milestones play a crucial role in marking important achievements and guiding project progression. With the ability to visually represent significant events and critical objectives, milestones provide clarity, direction, and alignment for project teams and stakeholders alike.
By leveraging tools like Visor, project managers can seamlessly integrate milestones into their Gantt charts, ensuring efficient tracking, communication, and decision-making processes.
If you’re creating a product roadmap you might also want to try these free agile product roadmap templates.