
How to Use Agile Gantt Charts in Project Management

A Gantt chart is a type of bar chart that represents a project schedule. It provides a visual representation of project tasks or activities plotted against time.
That might seem like it doesn’t work with the always moving, ever-iterating Agile project management approach that many teams rely on. While some Agile project management teams prefer to skip Gantt charts entirely, there are ways to mix Gantt and Agile to create an Agile Gantt chart that works for all your teammates.
To help you discover the ins and outs of Agile Gantt charts, we’ll be covering:
- Whether Gantt Charts fit the Agile or Waterfall model
- The benefits of using Agile Gantt charts
- How to use Agile Gantt charts
- Tools that let you incorporate Gantt charts into your Agile team
Is a Gantt Chart an Agile or Waterfall Tool?
According to the Association for Project Management, “Agile project management is an iterative approach to delivering a project throughout its life cycle.” The Agile approach focuses on delivering value to the customer in small steps rather than through a single, large-scale delivery at the end.
Agile emphasizes flexibility, collaboration, customer involvement, and continuous improvement throughout the project lifecycle. While Agile started in software development, it has been adopted in other industries beyond IT since then.
On the other end of the spectrum is the Waterfall method of project management. Waterfall is a traditional, linear approach to managing projects. It’s more of a step-by-step process from start to finish. It’s often depicted as a series of cascading phases (like a waterfall cascades down), with each phase dependent on the deliverables of the previous phase. Waterfall project management is structured with distinct stages and milestones.
Traditionally, a Gantt Chart would fall more under the Waterfall model, relying as it does on static dates and milestones; however, there are exceptions, which we’ll get into next.
Can you have Agile Gantt Charts?
There are cases where Gantt charts work well with and even add value to Agile planning. Nevertheless, there’s a certain amount of stigma in some Agile communities about using Gantt charts. The hard deadlines you find on a Gantt are often considered antithetical to true Agile project management.
However, when you’re dealing with organizations that use both methodologies – say your DevOps team is Agile, but your Marketing team uses a Waterfall method – a Gantt chart is a good way to bridge the gap, sharing details from the Agile side of things in a way that all stakeholders understand.
This is doubly important when different teams are using different project management systems. For instance, if development teams are using Jira, and Marketing lives in Asana and Hubspot, Marketing doesn’t have an easy way to understand what Dev is up to.
You can straddle the line with tools like Visor. Visor lets you connect to Jira data and share it as spreadsheet, timelines, and (of course) Gantt charts. Data’s automatically updated and can be shared with different Views designed for any team in your organization, keeping all teams informed and empowering them to collaborate more effectively.
Characteristics of an Agile Gantt Chart
So if it’s possible to have an Agile Gantt chart, what separates it from a plain old Gantt?
An Agile Gantt chart is just like a traditional Gantt chart, but it incorporates Agile principles and practices. While Gantt charts are used most often in teams that use a Waterfall approach, Agile Gantt charts are adapted to support the iterative and flexible nature of Agile methods. Here are some characteristics of an Agile Gantt chart:
- Dynamic and Iterative: Unlike traditional Gantt charts where the entire project is planned upfront, Agile Gantt charts are dynamic and iterative. They allow for adjustments and changes to the schedule as the project progresses and new information becomes available.
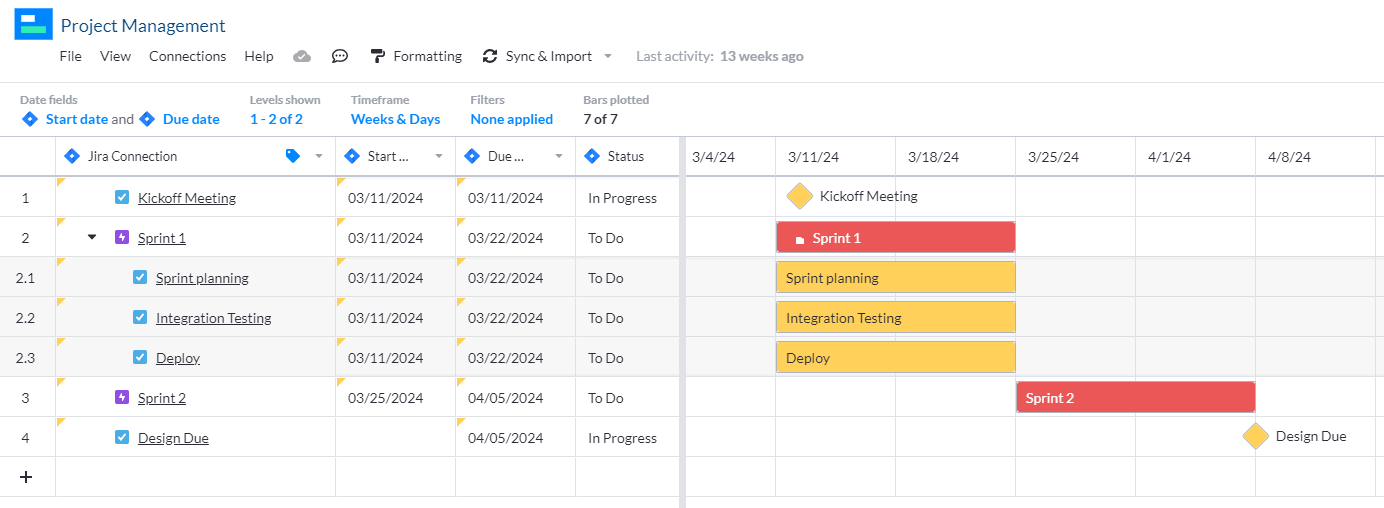
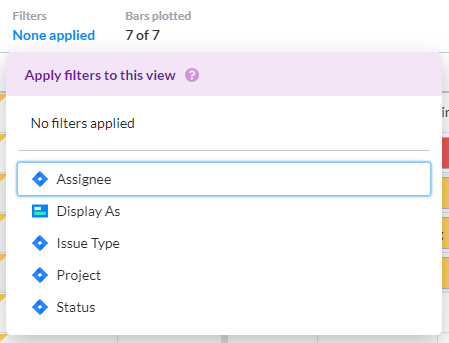
- Collaborative Planning: Agile Gantt charts help with collaborative planning and decision-making among team members, stakeholders, and product owners. They also offer a way to visualize the project schedule, so everyone can have discussions around priorities, trade-offs, and resource allocation. For instance, in Visor, teammates get a clear, simple view of Jira data displayed in a way that’s easy for them to understand. You can even filter the chart to include only information that’s relevant to stakeholders, so everyone’s focused on the data that matters most to them.
- Time-Boxed Scheduling: Agile Gantt charts typically use time-boxed scheduling, where work is planned in fixed time increments such as sprints (for Scrum) or cycles (for Kanban). Each iteration is represented as a block of time on the chart.
- Focus on Deliverables: Agile charts emphasize the delivery of value and focus on tracking the progress of specific deliverables or user stories rather than tasks. Each deliverable or user story may be represented as a separate bar or milestone on the chart.
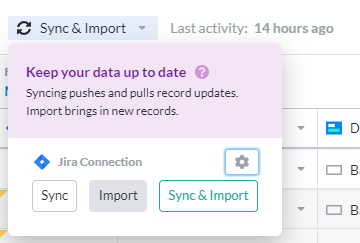
- Real-Time Updates: Agile Gantt charts are updated in real-time to reflect changes in the project status, such as completed tasks, new additions to the backlog, or adjustments to the schedule. This ensures that the chart always provides an accurate and up-to-date view of the project progress. For example, in Visor, Gantt charts are plugged directly into your Jira data and will update automatically as issues in Jira change.
Are Agile Gantt Charts used in Scrum?
While many Agile advocates say that Gantt charts aren’t accurate enough for use in Scrum, if you’re connecting your sprint data directly to your Gantt charts, there’s no reason you can’t use Agile Gantt charts in Scrum. (Tools like Visor usually let you make that connection, too.)
There are a couple of caveats. If you want to forecast when you’d deliver a project (as you would have to do in a typical Gantt chart), you’ll need a well-groomed backlog that’s prioritized and grouped into features or epics. You can then use sprints to predict approximately when work will be done.
Another thing to consider is that your Agile Gantt chart is more of a roadmap than a hard and fast plan. It’ll evolve as your projects evolve. If it can’t, you may need to switch to a more flexible tool for your Gantt charts. So if you’re using a tool that isn’t connected to data from your project management software, you may struggle to keep your Gantt chart agile.
Visor offers an easy-to-use Gantt chart that connects directly to information in Jira, Hubspot, and Salesforce, so your visualization changes as your priorities do.
Ways Project Management Teams Can Use Agile Gantt Charts
Though Gantt charts aren’t typically used in Scrum or Kanban, they do have some clear benefits for project management:
- Visualization of Iterative Work: Agile Gantt charts give you a way to visualize sprints or iterations. This helps Agile teams see how work is planned and scheduled over time, even if they’re working in shorter time frames.
- High-Level Planning: Gantts are also useful for high-level planning, providing an overview of the project timeline and major milestones. This helps stakeholders understand the overall direction of the project and the sequencing of key activities.
- Resource Allocation: You can use Agile Gantt charts to help teams to allocate resources effectively by showing who is responsible for which tasks and when those tasks are scheduled to be completed. This aids in resource planning and capacity management.
- Communication with Stakeholders: Gantt charts are a familiar and accessible format for communicating project plans and progress to stakeholders who are accustomed to traditional project management approaches. They provide stakeholders with a clear picture of what’s being worked on and when it’s expected to be completed.
- Integration with Traditional Project Management: In organizations that use a combination of Agile and Waterfall approaches, Agile Gantt charts serve as a bridge between the two. They help to align Agile work with overarching project timelines and milestones.
Tools for Creating Agile Gantt Charts
There are several ways to create your own Agile Gantt Charts, ranging from complicated (creating your own Gantt in Excel or Google Sheets, for example) to pretty darn easy. Take a look at two of the easiest for project managers – especially if they use Jira.
Agile Gantt Chart in Jira
Creating an Agile Gantt chart directly in Jira can be challenging, as Jira’s native features are more focused on Agile methodologies like Scrum and Kanban than traditional Gantt charts. It does offer a timeline that has some elements of a Gantt chart, though it lacks some key features, like milestones.
If that doesn’t fit your needs, you can try an app that connects to Jira, like Visor, to share your data in a Gantt chart.
Agile Gantt Chart in Visor
With Visor, you can easily sync your Jira data into a spreadsheet-inspired workspace. In addition, you can transform your data into a Gantt chart, timeline, and more.
Check out the short video below to see how you can create a free Gantt chart in Visor.
Add a Gantt View That Stays Agile
Agile Gantt charts offer a unique blend of traditional project management with the iterative nature of Agile. While not a core component of Agile practices, Agile Gantt charts provide valuable insights and benefits when used effectively in Agile environments. And a tool like Visor lets you connect your data directly to your Gantt, ensuring it stays up-to-date and agile. Agile Gantt charts, coupled with Visor’s seamless data connectivity, empower teams to adapt swiftly to changes and maintain alignment with project goals throughout the iterative process.
If this article helped you get the hang of Agile Gantt charts, explore other, related topics:
- Jira Gantt Charts: Tutorial & Guide for Project Managers
- The Easy Way to Color Code Your Gantt Chart: Color Presets & Tips
- Confluence Gantt Charts