Confluence Gantt Chart: Your How-to Guide with Examples

Start using Visor today
- Visualize all your projects and data

- Roll up multiple projects into portfolio views
- Try Visor for FREE
Confluence Gantt charts allow you to visualize your project data in a central location.
And while Atlassian’s Confluence provides many ways for teams to organize and share information, not all the Confluence Gantt chart options help teams stay on the same page.
Visuals are an important element for maintaining team and stakeholder alignment, which is why we show you a few ways you can make a Gantt chart for Confluence — even showing you a free solution that stays in sync with Jira.
By the end of this post, you’ll know the basics of Confluence Gantt charts, including:
- Why it makes sense to add Gantt charts to Confluence
- The limitations of Confluence’s free Gantt chart Macros
- Examples & tutorials for free Confluence Gantt chart options
- What Gantt chart templates you can use for Confluence
Why Share Gantt Charts in Confluence?
Atlassian’s Confluence is basically a knowledge base that allows your team to collaborate on different pages called “spaces”. Each space can represent a different kind of wiki, offering details about different projects or teams within your company.
Confluence offers an easy-to-understand way of sharing information, which makes it a natural location for a Gantt chart. Gantt charts show projects on a timeline, allowing you to see when different aspects of a project begin, end, and overlap.
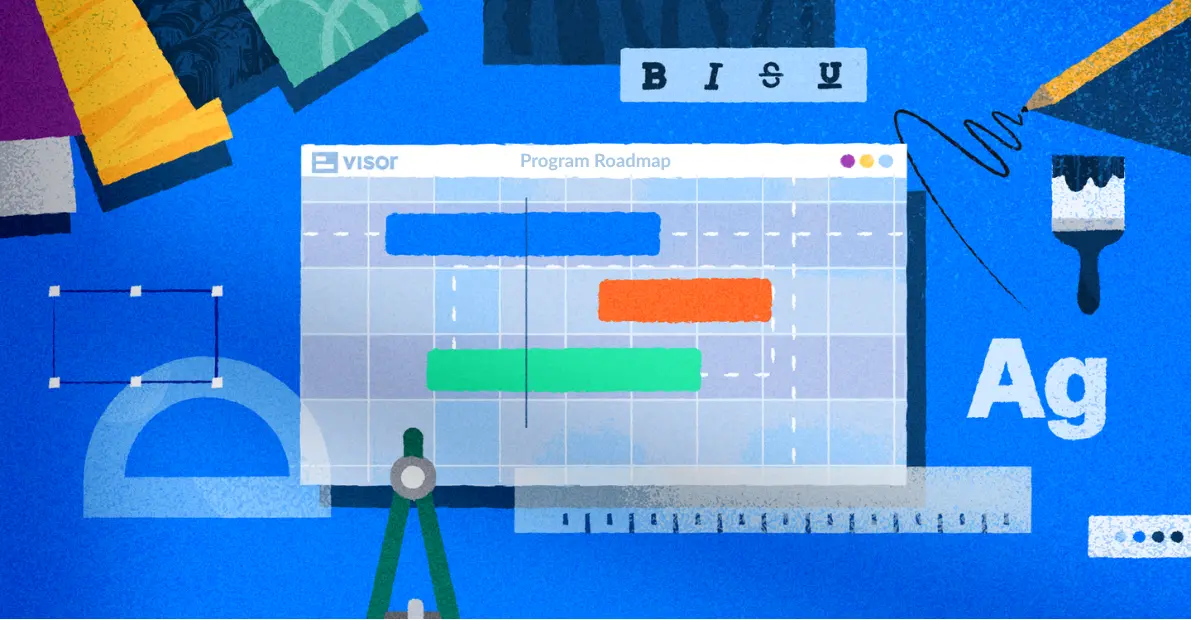
Gantt chart created in Visor using Jira data:
A Gantt chart can highlight key milestones, track parent-child relationships between tasks, and display information in a view that’s customized to meet the needs of specific groups of stakeholders. For instance, in Visor you can filter a Gantt chart so that it only shows tasks relevant to marketing or the C-Suite.
Gantt Chart Showing Epics for Executive Audience:
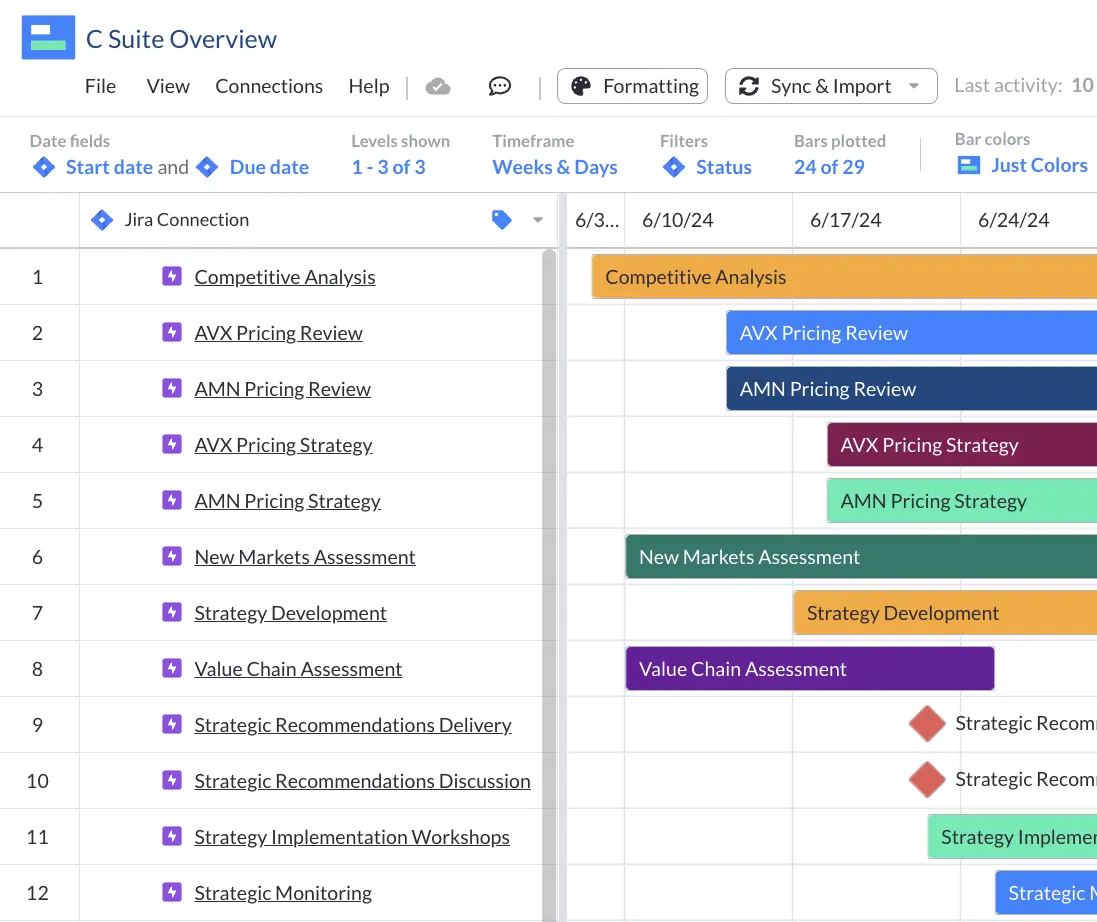
In a Confluence space, Gantt charts offer a highly visual way to keep stakeholders updated about ongoing projects.
Can You Create a Gantt Chart in Confluence?
Confluence offers a Roadmap Planner Macro, which allows you to create a very basic view of project data that you manually input. In Confluence, Macros are widget-like functionalities that you can add to your Confluence page. For folks who use Jira and create Gantt charts using Jira’s Timeline chart, there is also a Timeline Macro in Confluence, which allows you to embed your Jira Timeline, although there are limitations to what you can do with both of these options.
Confluence allows embed codes, allowing you to always add Gantts that you make elsewhere. A lot of Confluence users are also Jira users (since they’re in the same Atlassian family), so we’ll show you how you can share a Jira Gantt chart in Confluence in this post. Visor’s Gantt chart option stays in sync with Jira project data and offers an embed code, making it an ideal option for Confluence Gantt charts.
How To Create Confluence Gantt Charts – Video Tutorial:
What Are the Limitations of Confluence’s Own Gantt Chart Option (Roadmap Planner Macro)?
Confluence is an excellent tool for making and maintaining a wiki, but it has a few limitations, especially if you want to add Gantt charts to your Confluence spaces.
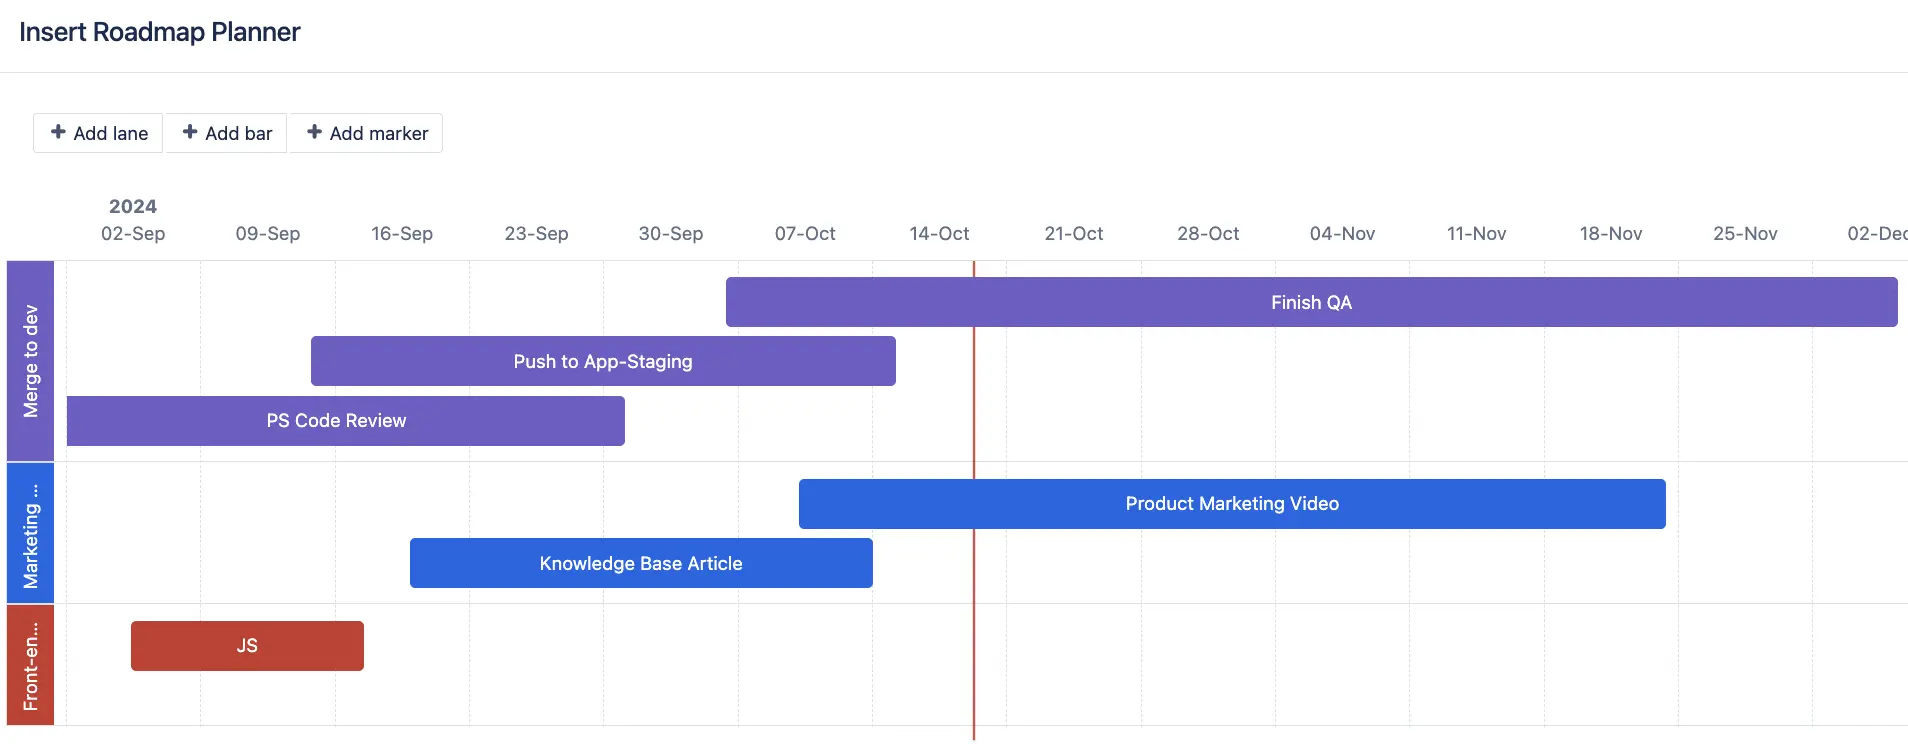
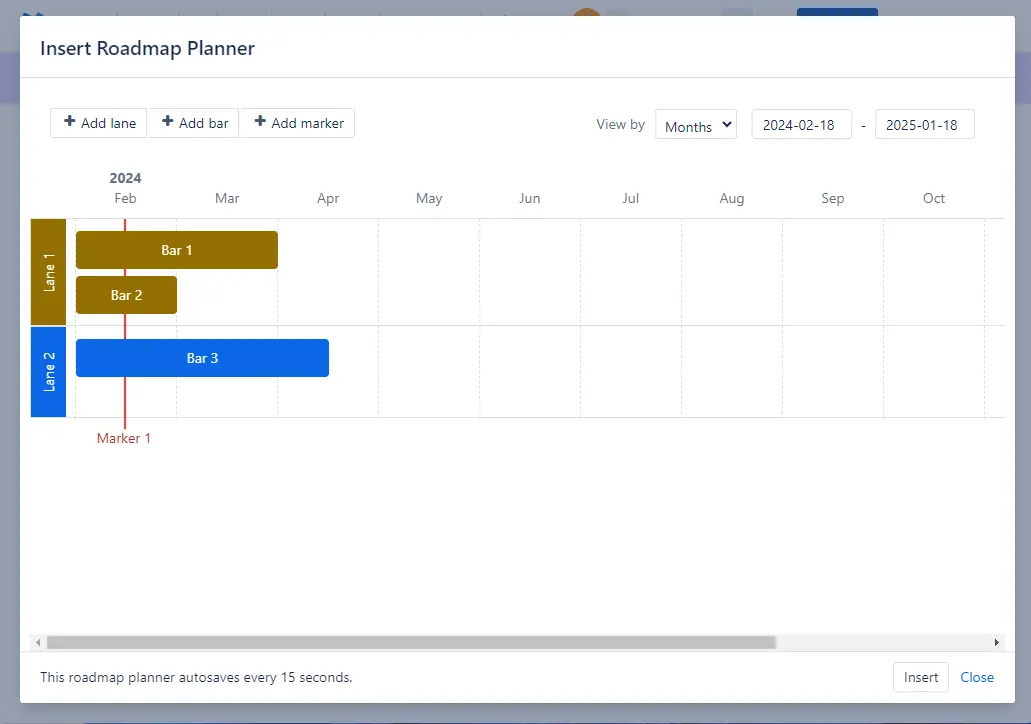
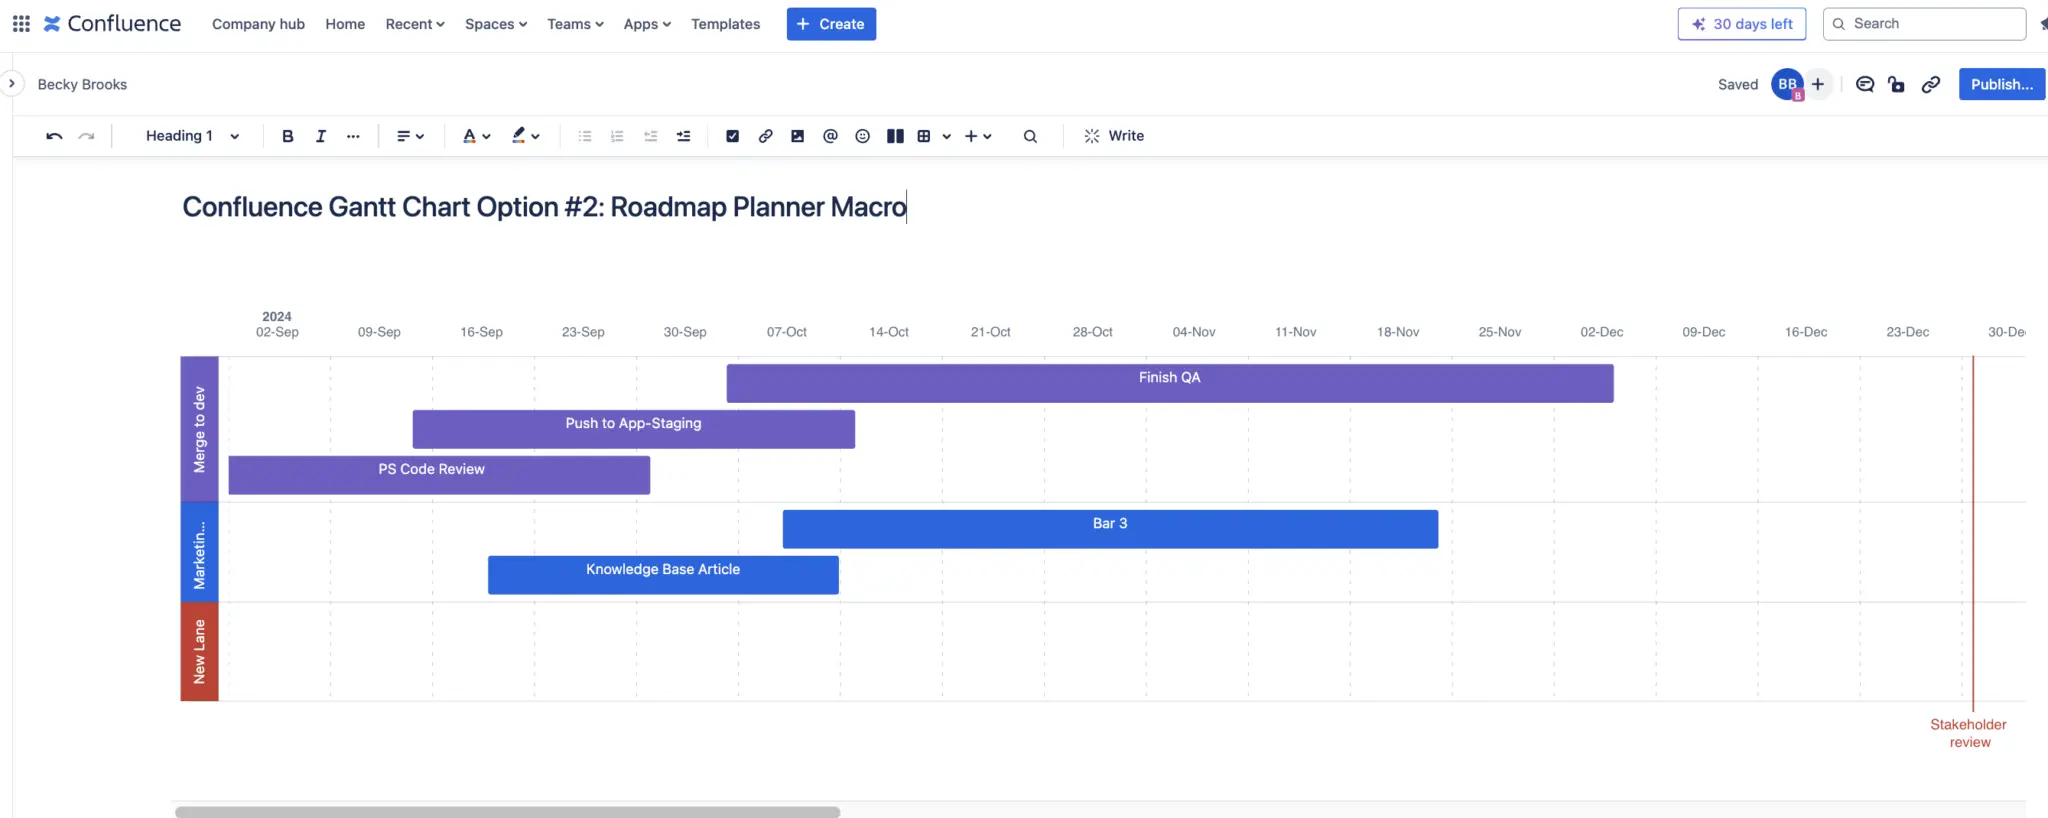
There is a very basic Roadmap Planner Macro in Confluence (see example below), but you’ll have to enter the data on your own, which isn’t practical if you’ve already got a sizable amount of data to share (or expect your data to grow in complexity in the future).
Roadmap Planner Gantt in Confluence:
As we mentioned, there’s not a robust built-in Gantt chart tool in Confluence, so if you want to add a genuine Gantt chart, you’ll need to use the Jira Timeline Macro (which is Jira’s free roadmap option), or use an outside tool, like Visor.
Here’s Alex Ortiz, certified Jira expert giving his take on the various Atlassian Gantt chart options and how Visor measures up:
Tools like Visor offer you multiple ways to view data, including a Gantt chart of course, but also capacity planning charts, Jira dashboards, a Table view. Visor connects to your Jira data, allowing you to create varied visualizations of your Jira project data. Visor also offers an embed code, allowing you to input Gantt charts in Confluence.
You can also share all these visualizations (including Gantt charts and roadmaps) that use live Jira data with all stakeholders even if they don’t have access to (or know how to use) Jira.
As you probably know there’s no way to provide guest access to Jira, giving you a useful workaround and greatly improving your sharing, stakeholder reporting, and collaboration options.
Visor offers project management Gantt chart templates and release roadmap templates that make it easy to visualize your Jira data.
How to Embed a Gantt Chart in Confluence
Because the built-in Confluence Gantt chart Macros are fairly basic, many people choose to embed Gantts they make elsewhere into their Confluence page.
If your goal is to share data with stakeholders, embedding Gantt charts from an app that syncs with apps like Jira helps you avoid sharing stale data or manually inputting data (as Confluence’s built-in Roadmap Planner macro forces you to do).
There are a few different solutions out there that allow you to create robust Gantt charts that you can embed into Confluence. functionality. Visor is one such option, which allows you visualize your Jira project plans using a bi-directional Jira integration; this Jira syncing ensures your team always has the latest data, even if they’re not Jira users.
And it doesn’t take long to add your Visor Gantt chart to a space in Confluence, either. Here’s how to do it:
Step 1: Create a free Jira Gantt chart in Visor
Visor makes it easy to sync your Jira data into a spreadsheet-inspired workspace. From there, you can visualize your data into a Gantt chart, roadmap visualization, and more.
Below is a short video that shows you how to create a free Gantt chart in Visor:
Step 2: Get your embed link from Visor
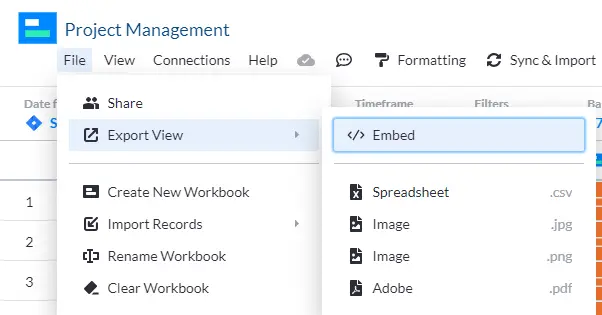
Open the Visor Workbook you want to embed in Confluence. Select File on the top right. Select Export View and then Embed.
Embedding a file in Visor:
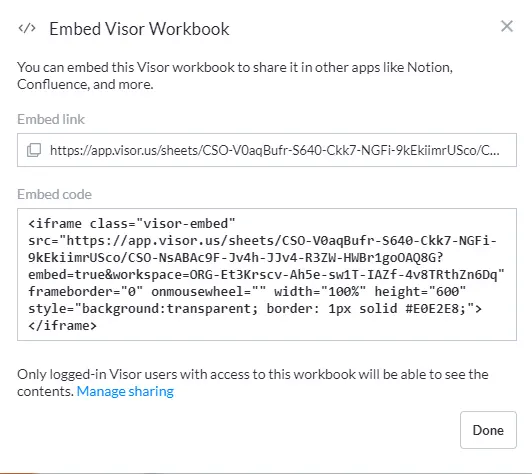
This will take you to your embed options. Just click the copy icon under Embed link to save the URL:
Step 3: Open an iFrame in Confluence
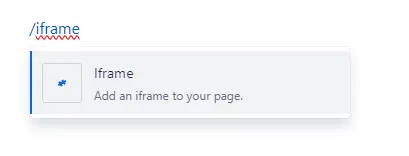
Go to Confluence and open the space you want to add your Gantt chart to. Type /iframe in the space you would like the Gantt chart to go. You’ll see an option to insert an Iframe element on the space:
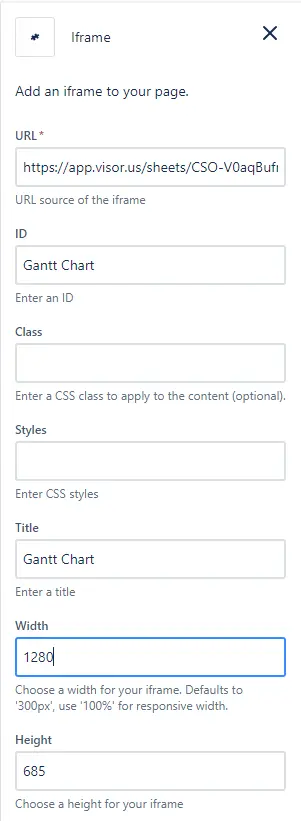
Step 4: Embed your Gantt chart in Confluence
Select the pencil icon to edit your settings. Enter your embed link under URL. Then set height to 1280 and width to 685:
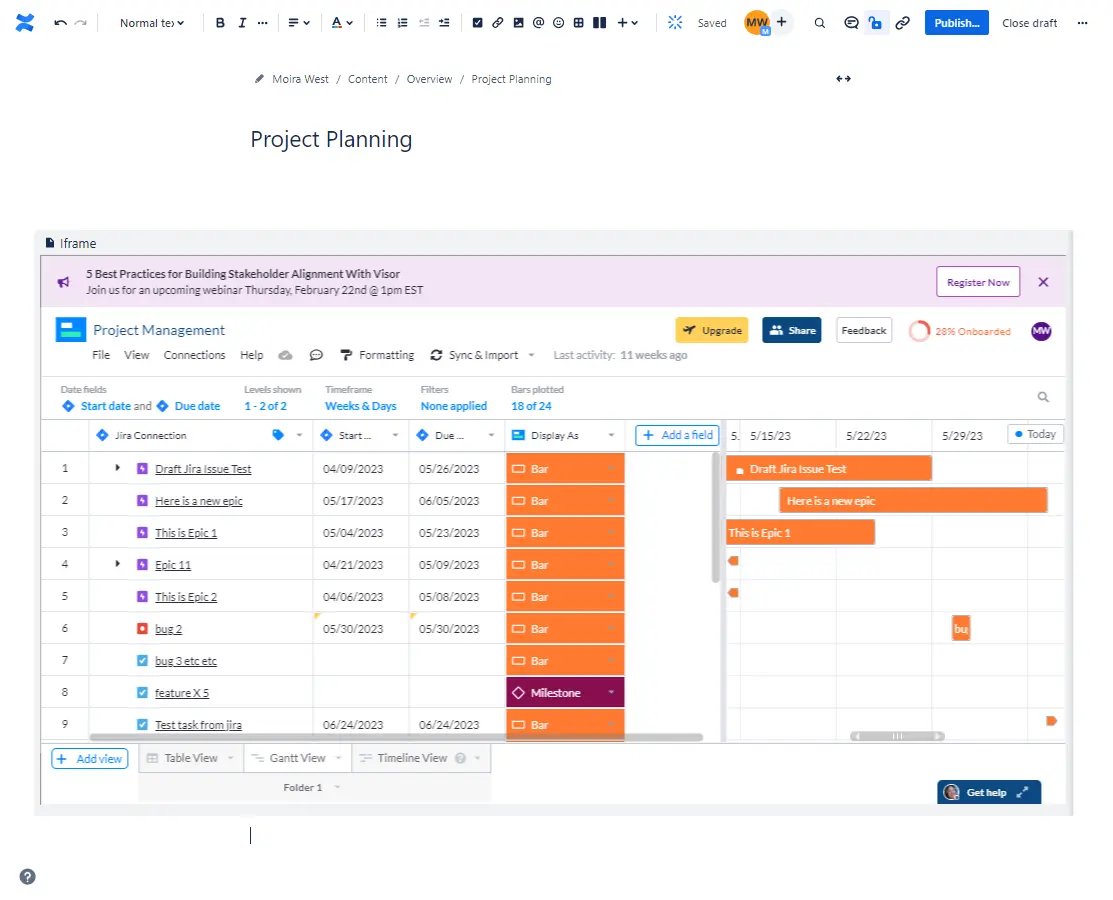
Your Gantt Chart will appear on your Confluence space. If you update your data in Visor later on, the changes will be reflected in the embed in Confluence.
Integrated data in a Visor Gantt chart that’s embedded in Confluence:
Bonus: Adding Milestones to Gantt charts in Confluence
While there are several other ways to share roadmaps in Confluence (we’ll get to them in a minute), most don’t offer Milestones. (For example, you can’t create Jira Milestones natively in Jira.)
There are many project Milestone examples but broadly speaking, they are a visible checkpoint that indicates an important, hard date. Visor allows you to indicate those important moments using our Milestone feature.
You can import Jira data into Visor and add key Milestones to them using Visor’s Gantt charts. You can then embed your Gantt charts in Confluence so that important Milestones are visible to stakeholders.
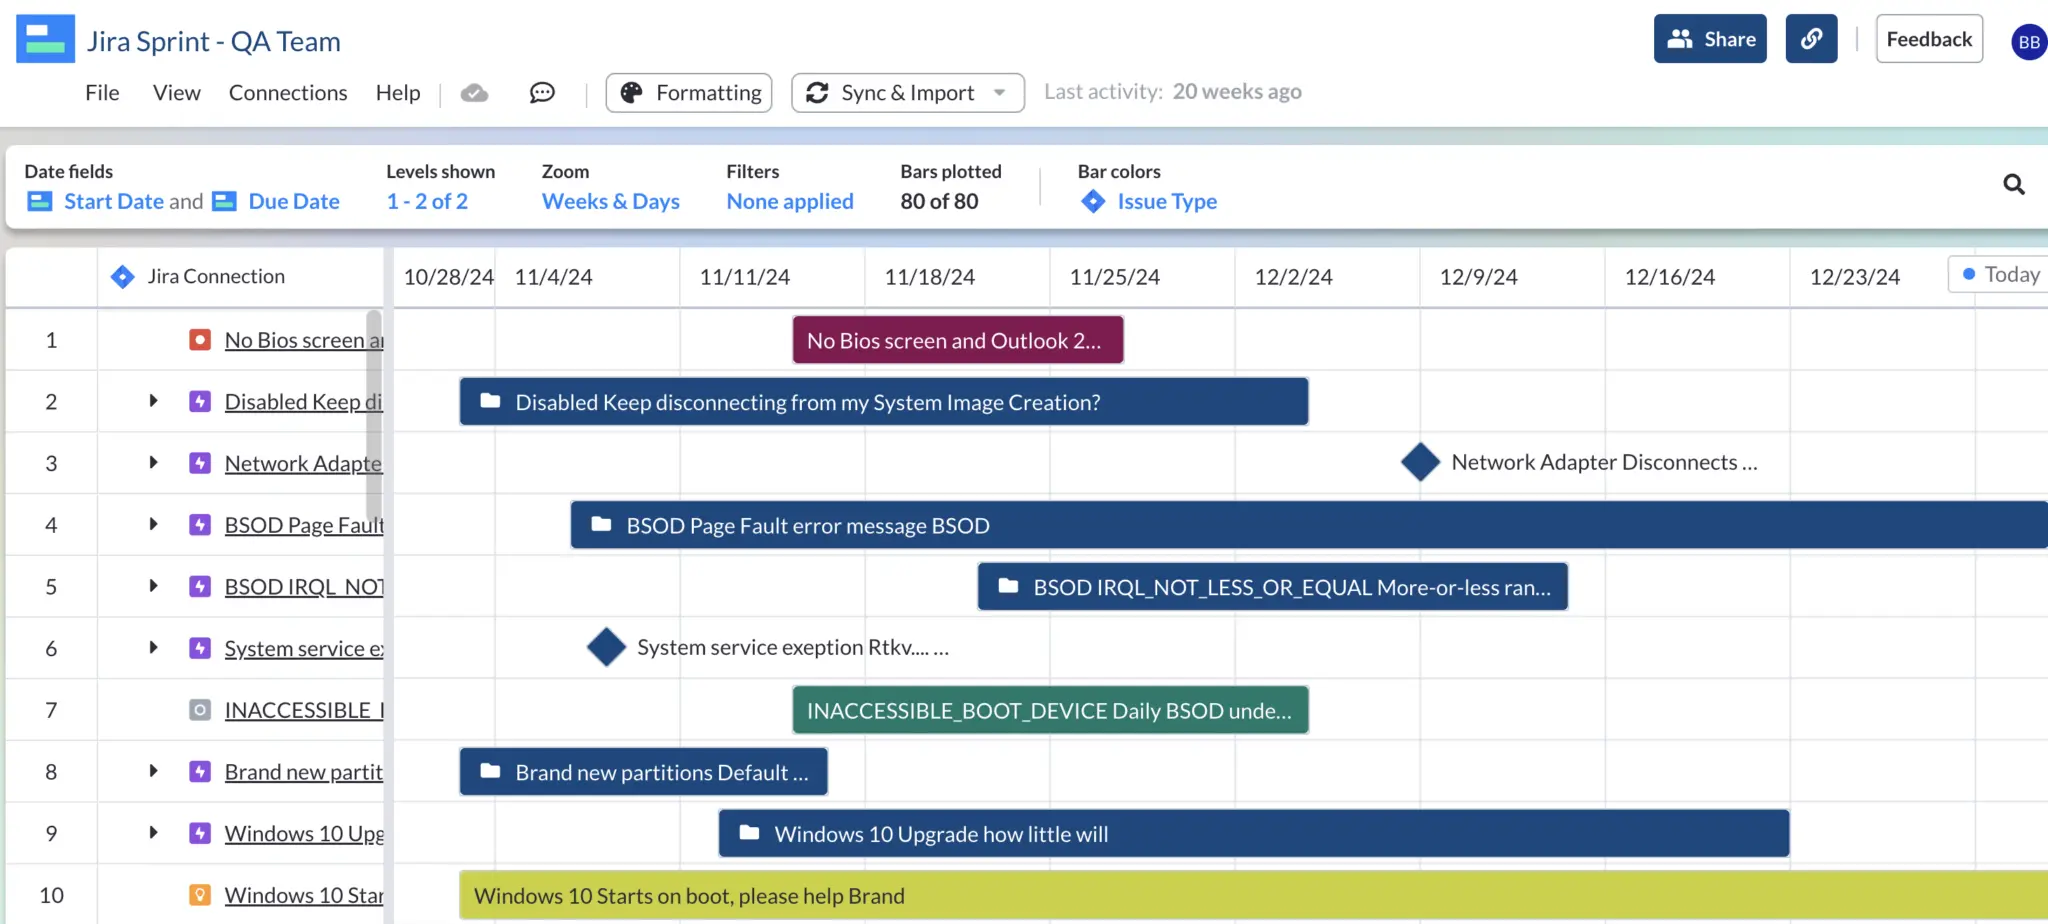
Visor’s Gantt View, which can be embedded directly into Confluence:
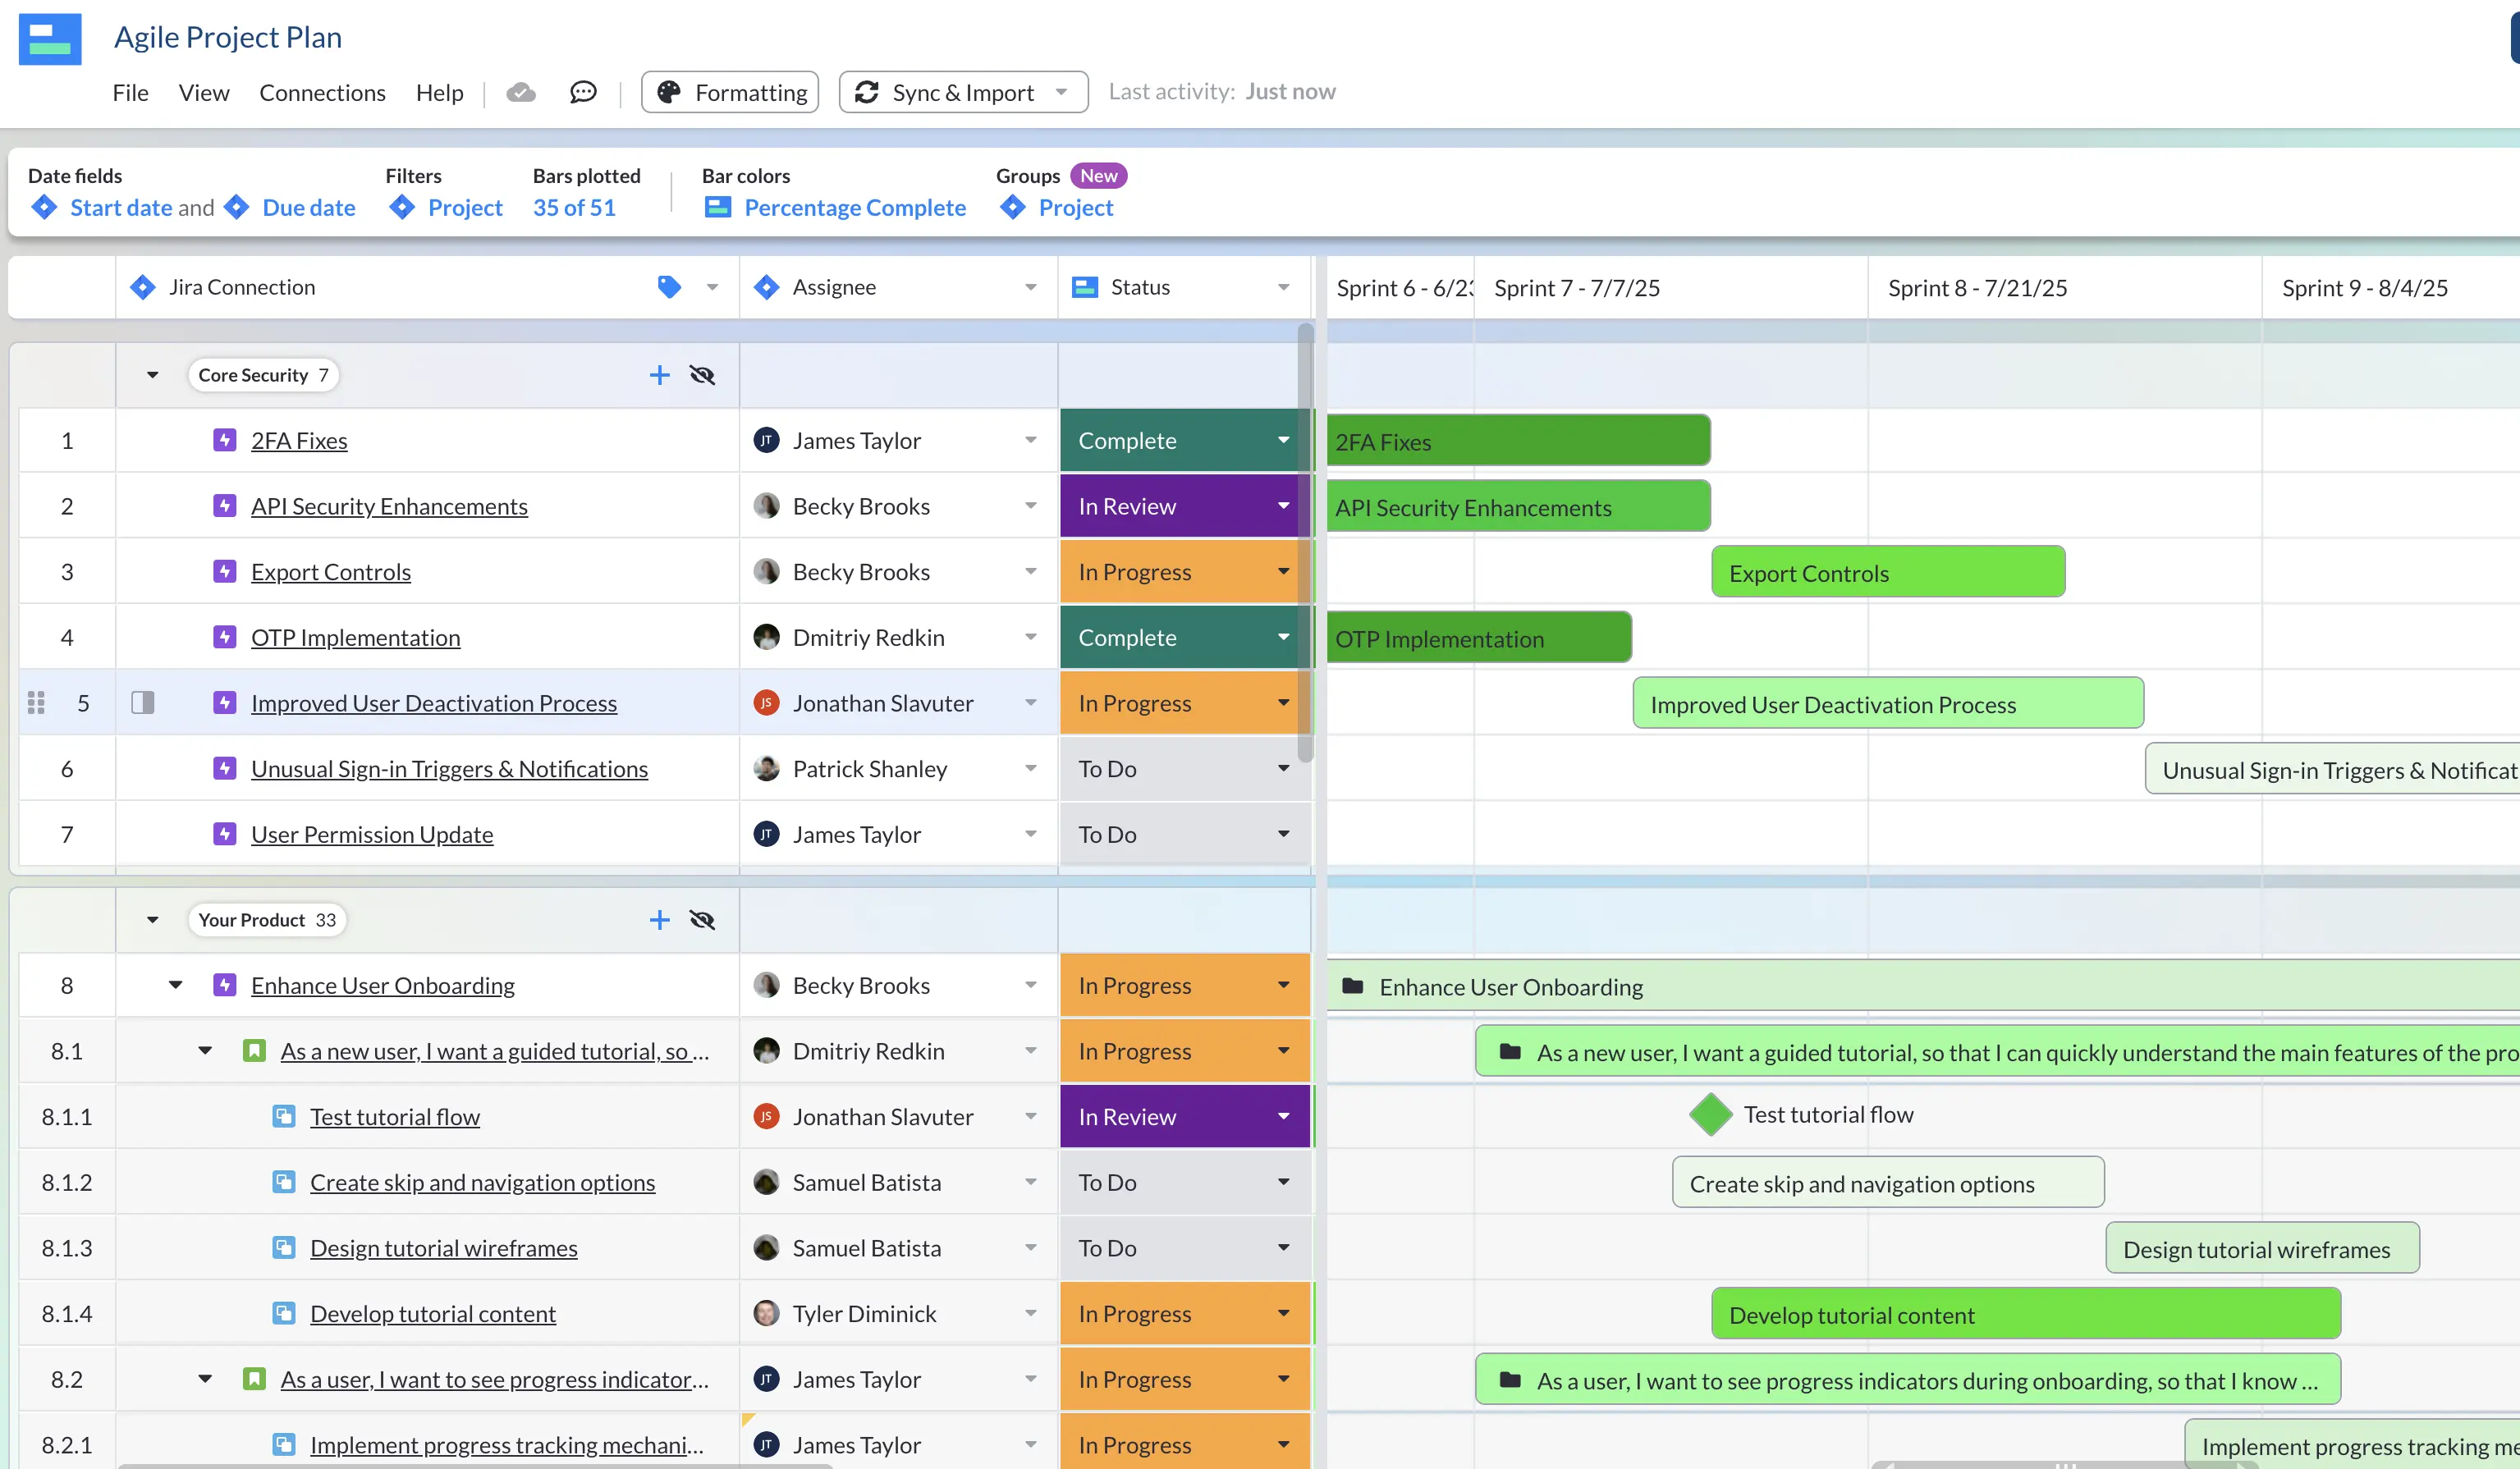
This Gantt chart uses our Agile Gantt Chart template. You can explore more of our Gantt chart examples in our Template Library.
Take a look at our post on using Milestones in Gantt charts to understand more about what they are and how to use them correctly (with some useful examples).
Bonus: Color-coding your Gantt charts
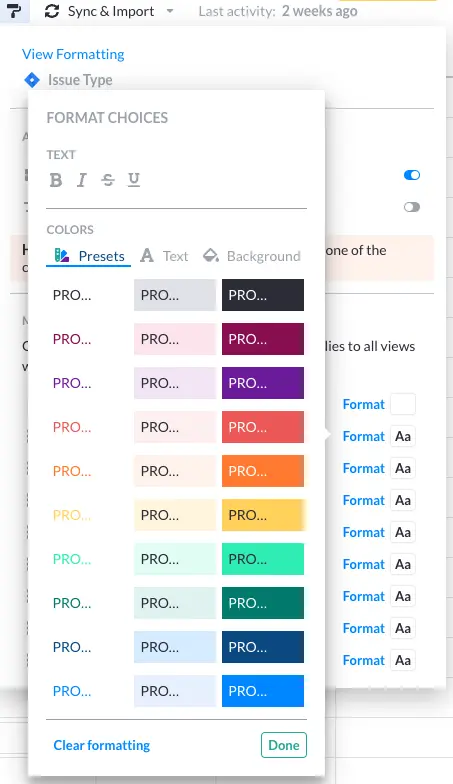
If you want to make your Gantt chart look more attractive for the stakeholders viewing it in Confluence, and leverage color theory to aid communication, you can do that in Visor, too. Visor allows you to set conditional formatting, so that you can assign colors based on criteria you choose. For instance, you could indicate a project’s status was done with a green color.
If you’d like to learn how you can make your project plans easier to read, check out our post on how to color code your Gantt chart.
Beautiful color coding in Visor:
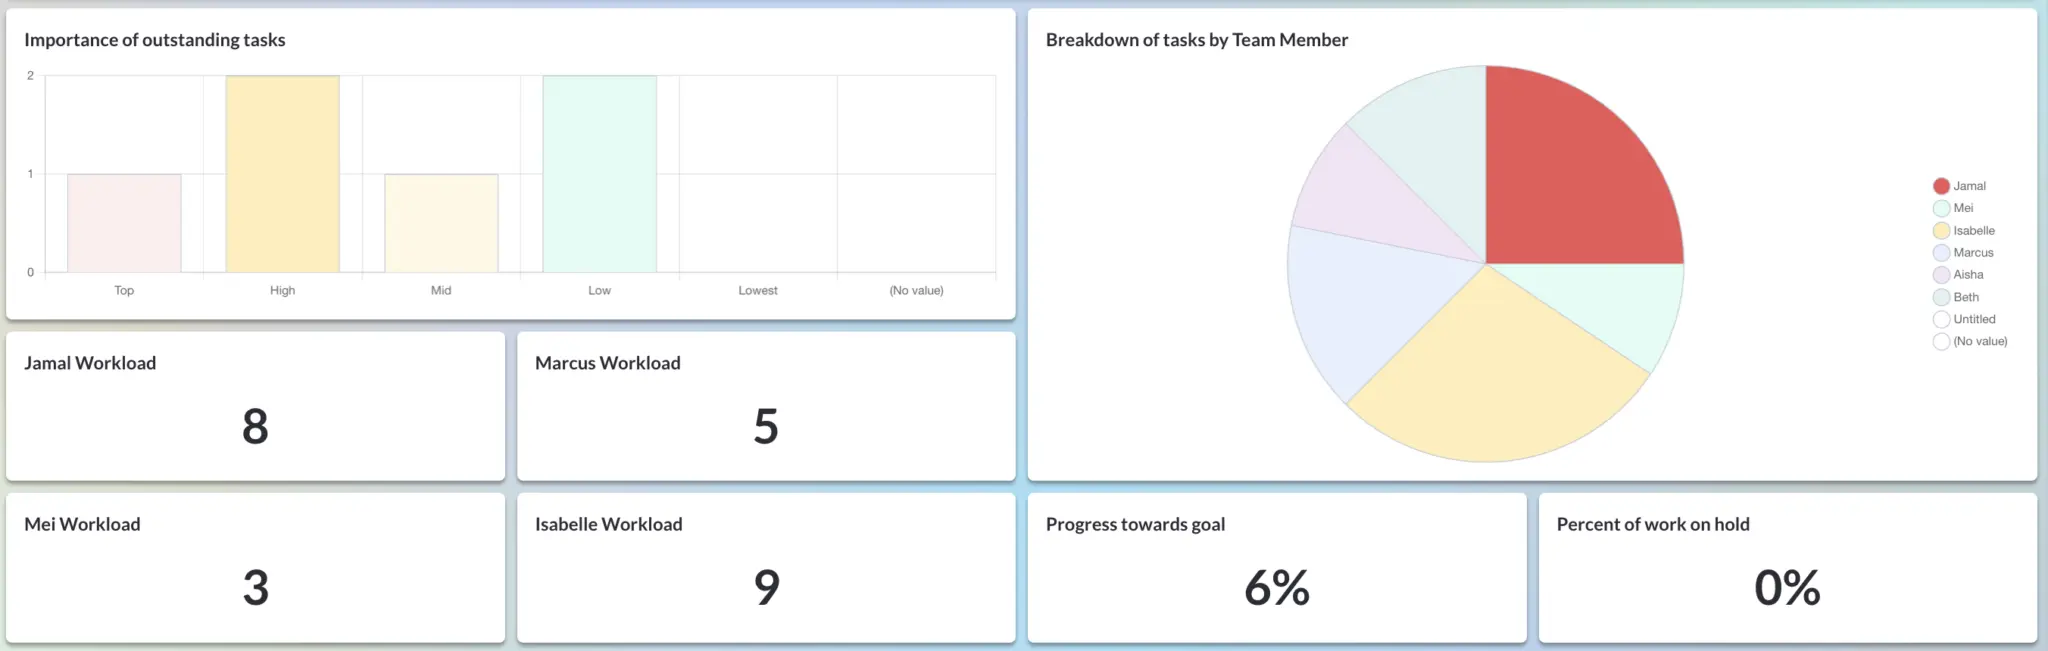
If you’re presenting to stakeholders and worry that a Gantt chart might lose them, take the same information and present it in a Dashboard. It’s the same information from your Gantt charts, just arranged into a crystal-clear, colorful set of charts and graphs that you can customize to help make the information even easier to digest.
A workload overview Dashboard in Visor:
How to Use Confluence’s Roadmap Planner Macro
While Confluence’s Roadmap Planner doesn’t offer a robust Gantt chart, it does provide a simple roadmap visualization. It’s a very DIY system – you’ll have to add in all your data manually, so it’s not the best choice for extensive data sets. However, if you want a quick, easy way to share a basic roadmap, this might be for you.
Here’s how to add it to your Confluence spaces:
Step 1: Insert your Roadmap
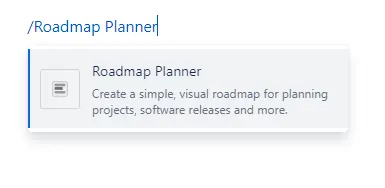
To add a roadmap in Confluence, simply type /Roadmap Planner. You’ll see the Roadmap Planner element appear:
Click on it and the Insert Roadmap Planner popup will appear:
Step 2: Customize your roadmap
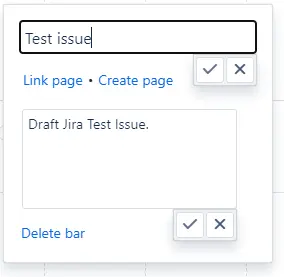
While you’re in the Insert Roadmap Planner screen, you can change parts of your roadmap by clicking on different areas.
For instance, you can click on a lane to see editing features that would apply to the whole lane, like colors and the lane’s title:
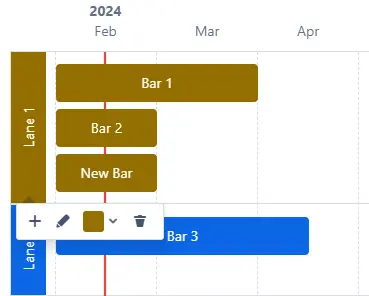
Selecting a bar will give you options for editing just that bar. You can add a different title, link to a space in Confluence, or add a description:
Once you’re happy with your roadmap, click Insert, and the roadmap will be added to your Confluence space. If you want to edit it later, you can click on the roadmap and select the pencil icon to get back to the edit screen.
How to Add a Jira Timeline to Confluence Using Macros
Jira Timelines are Atlassian’s own solution for users looking for a Gantt chart. We’ll show you how to add them in Confluence in just a moment, but before we do, let’s talk about when you should go with a Jira Timeline and when a true Gantt chart is more appropriate.
The difference between Jira Timeline and a Gantt chart
While Jira does not have an official Gantt chart, its Timeline view is similar, but lacks crucial features you’ll want if you’re looking for a real Gantt chart. You can get this functionality by upgrading to Jira Plans (formerly Advanced Roadmaps) or by using a better value, integrated Jira app with more true Gantt chart features like Visor.
However, if you’re looking for a chart that’ll get into more detail and explore how your project will come to life, you probably want a Gantt chart rather than a Jira Timeline.
We dissect Jira Timelines vs. Advanced Roadmaps for more detail.
If you’re just looking for a basic roadmapping tool to share high-level Jira data in Confluence, then Jira Timeline will work just fine.
How to Connect to a Jira Timeline
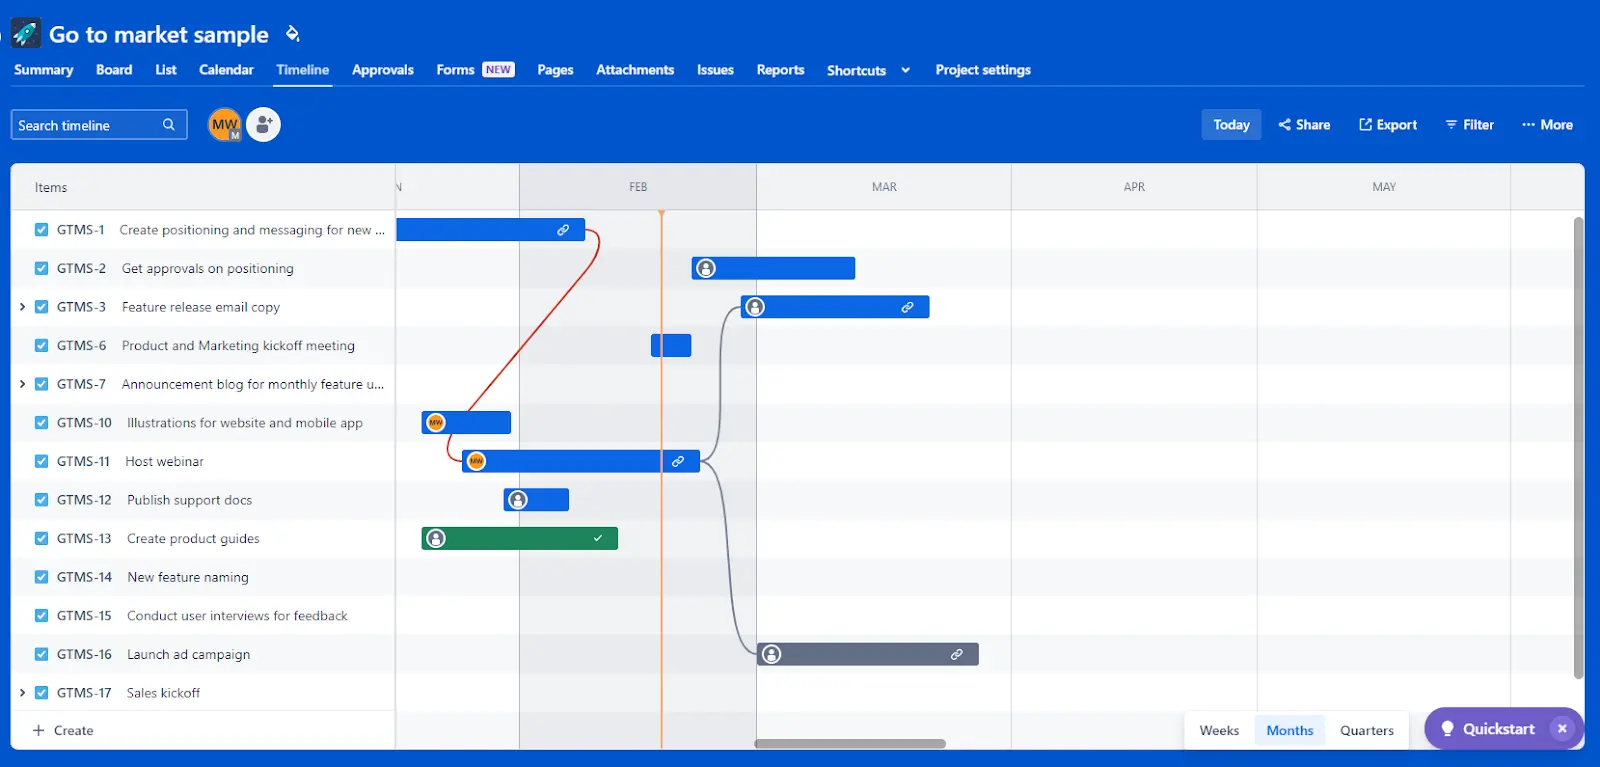
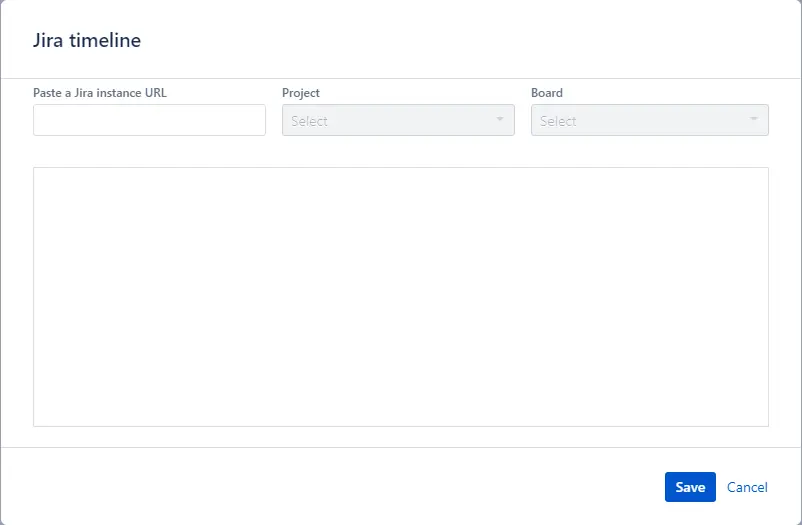
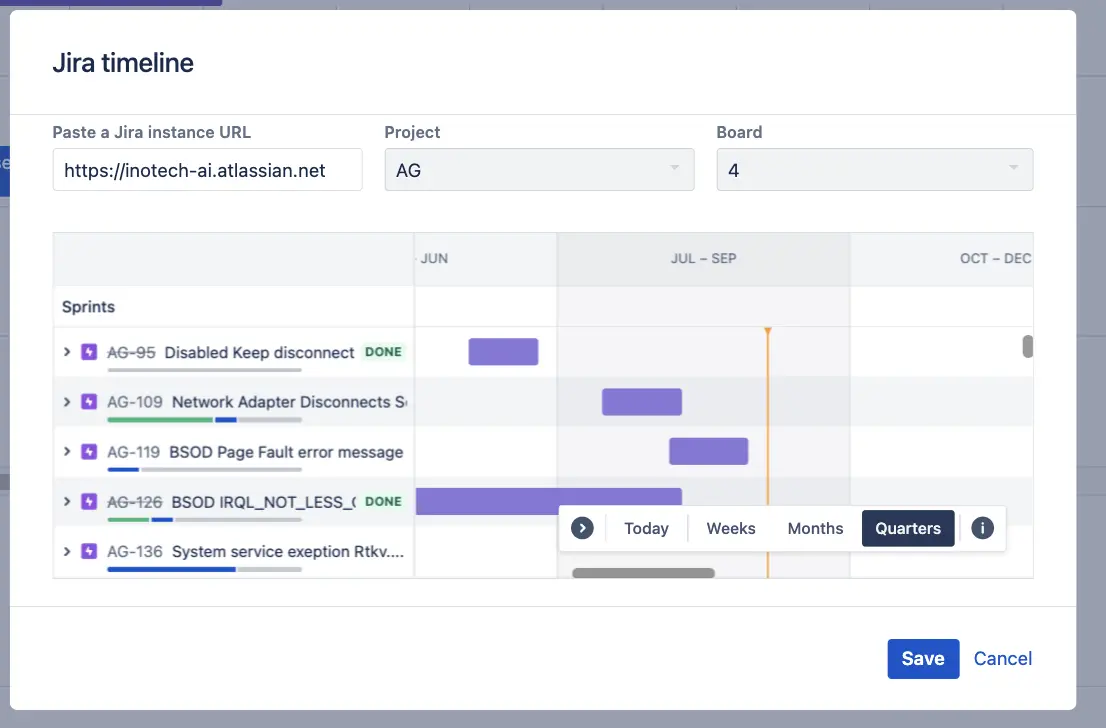
Adding a Jira Timeline to Confluence is pretty simple. Just open the space you want to add a Timeline to and type in /jira timeline. The Jira Timeline element will appear.

Select Jira Timeline and a popup will appear. Enter your Jira instance URL, the Project you want, and the Board you want to display.:
Your Jira Timeline will appear in Confluence. As you update your data in Jira, the changes will be reflected in the embed in Confluence.
Examples of Free Confluence Gantt Chart Options
All of the options that we discussed in this post (e.g., Visor, Roadmap Planner Macro, and Jira Timeline Macro) are free to get started with. But how they do they stack up in terms of output? Below, we have examples of what these Gantt charts look like in Confluence.
Visor’s Confluence Gantt Chart Output:
You can check out Visor in the Atlassian Marketplace. Visor’s two-way Jira syncing allows you to create colorful Gantt charts that you can also embed elsewhere (like Confluence):
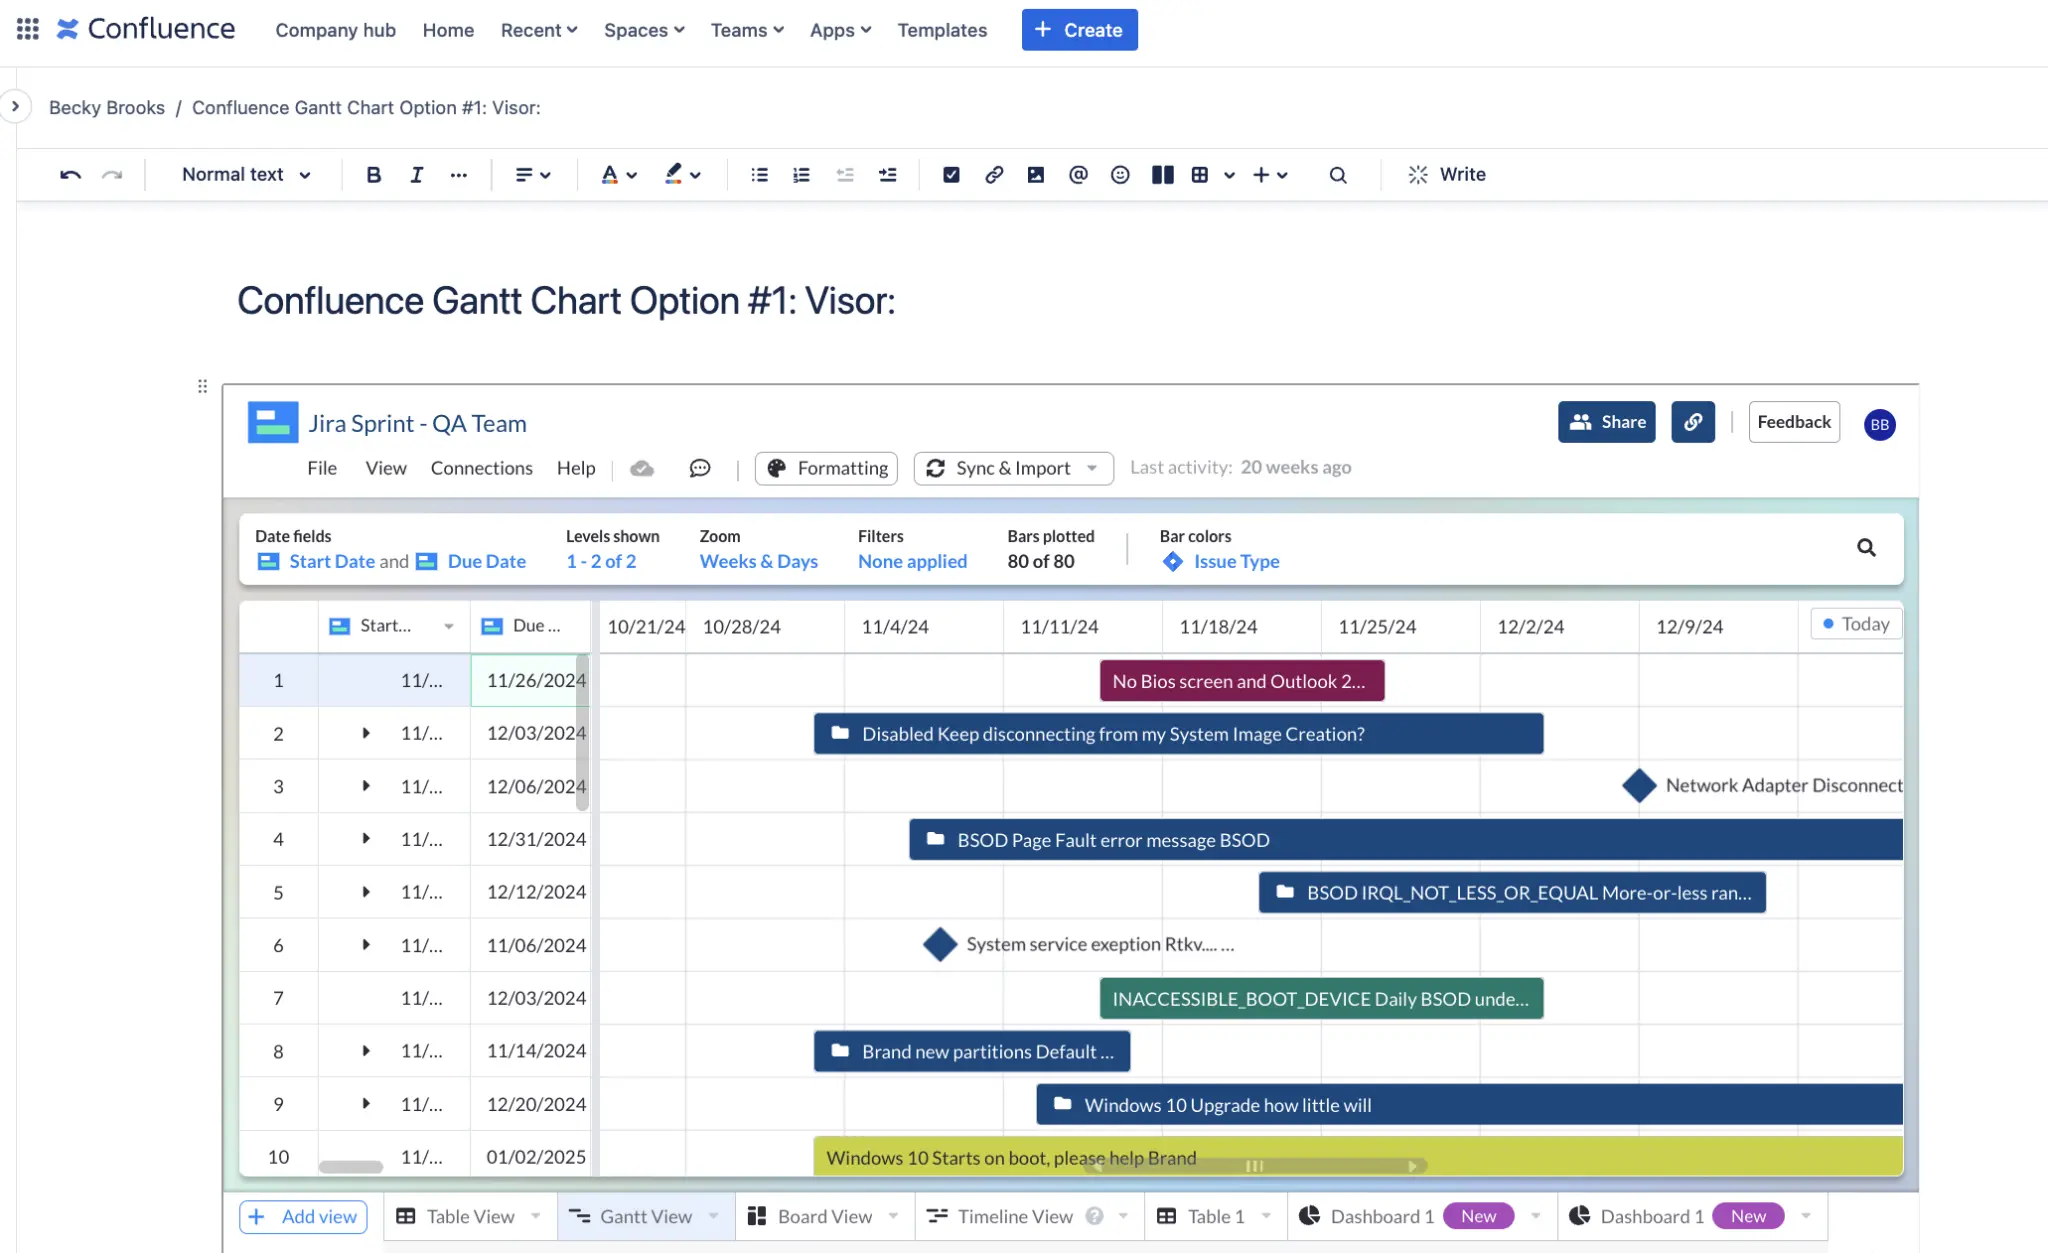
Note: Users will also have to put in a Visor verification code to view a Gantt chart embedded in Confluence. You can grant people access to your Gantt charts directly in Visor.
Confluence’s Roadmap Planner Macro
With this option, you can manually create a basic Gantt chart or roadmap. However, you cannot sync the data in this visualization with apps like Jira. Also, you can’t show data hierarchies or choose the exact color you want.

Note: You must manually input and update all data in this Macro for it to stay up to date. The other two options allow you to show Gantts that stay in sync with Jira.
Confluence’s Timeline Macro
Confluence also offers the ability to add a Jira Timeline into Confluence.
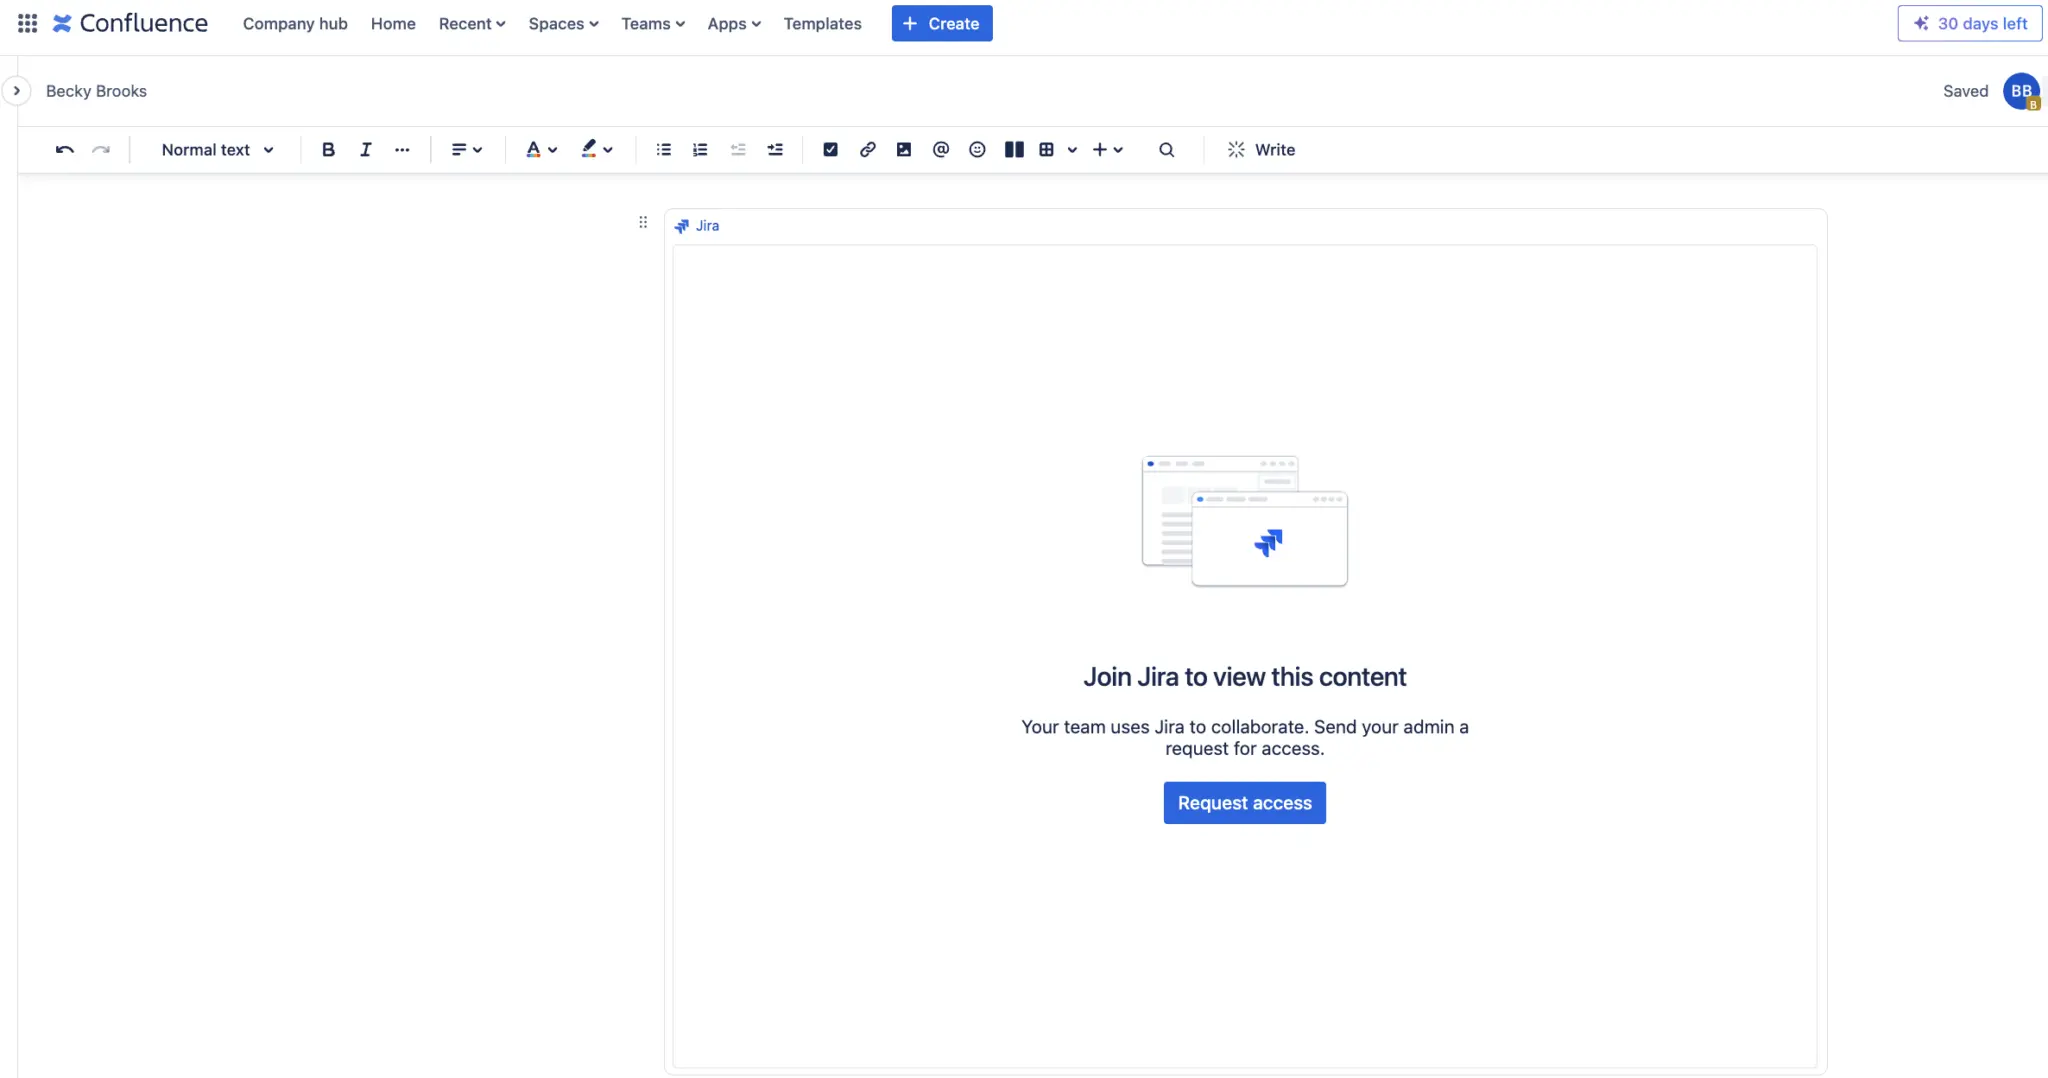
For this to work, you must already have a Timeline in Jira that you created AND the people accessing this Confluence page must also have access to Jira. If not all your collaborators in Confluence can access Jira, we recommend using the Visor option instead.
If you don’t have access to the Jira account where the embedded Timeline was created, you’ll get a screen like the one you see below. This option, therefore, only works if you’re sharing your Gantt chart with fellow Jira users who have access to your Jira instance:
Confluence Gantt Chart – In Summary
Gantt Charts in Confluence are not built-in, despite the desire of so many Confluence users to represent and share their data in Gantt Charts. While Confluence is an excellent collaborative knowledge-sharing platform, its lack of native Gantt chart functionality poses a serious limitation for many users.
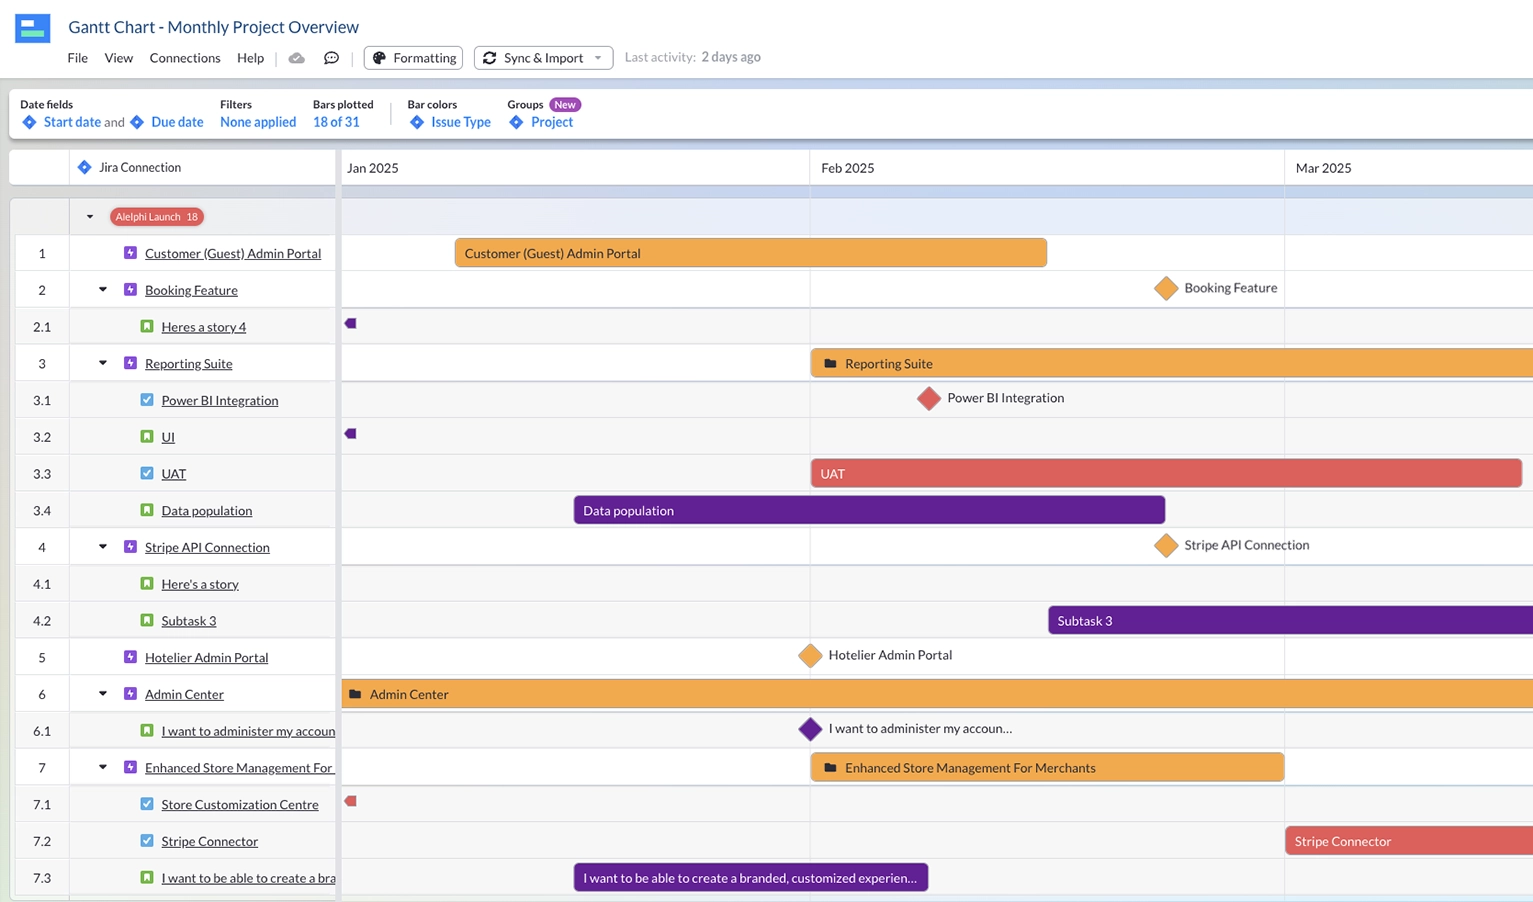
There are a few different solutions out there, like Visor, which allow you to create proper Gantt charts which you can then easily embed into Confluence. There are many templates you can use for Confluence Gantt charts in Visor. And unlike Google Sheets Gantt templates or Gantts you manually make in Excel, Visor’s Gantt templates stay in sync with Jira.
Example of Jira Data in Visor’s Monthly Gantt Chart Template:
Using solutions like Visor gives you the benefits of full spec, easy to use Gantt Chart software, but within Confluence, enabling you to overcome the limitation of a lack of an in-built Gantt Chart tool in Confluence.
If the solution you use has the same bi-directional integration that Visor does, it also means your data stays in sync, in tact, and you don’t need to worry about manually entering or updating anything.
Visor’s robust features, including milestone tracking and customizable Gantt chart color-coding, enhance project visualization and stakeholder engagement within the Confluence environment. We also have tons of tips and guides on topics like making an Agile Gantt chart.
In short, leveraging Visor lets you enrich Confluence’s capabilities, enabling teams to effectively communicate project progress and milestones.