How to Use Agile Gantt Charts in Project Management
Agile Gantt charts might sound like a contradiction. After all, agile purists often feel that committing to dates is antithetical to many of the 12 Agile Principles. This creates inherent friction as project managers need dates to plot a Gantt chart.
But, alas, the world is a complex place, filled with contradictions. And Gantt charts intermingling with Agile teams is no different. After all, the Gantt chart has helped manage countless projects since 1910 when its creator, Henry Gantt, (who launched projects like the Hoover Dam) first started using his popular Waterfall method.
Waterfall methods are linear, progressing predefined project stages over time. In contrast, agile methodologies are iterative; they plan, test, and launch iterations often. The “end” is less static in agile.
Still, it might come as a surprise that agile PMs who adhere to an ever-iterating approach could commit to Waterfall methods at all. But in this article, we’ll reconcile how agile teams can use Gantt charts. If you want to try creating your own agile Gantt chart now, use our free agile gantt chart template.
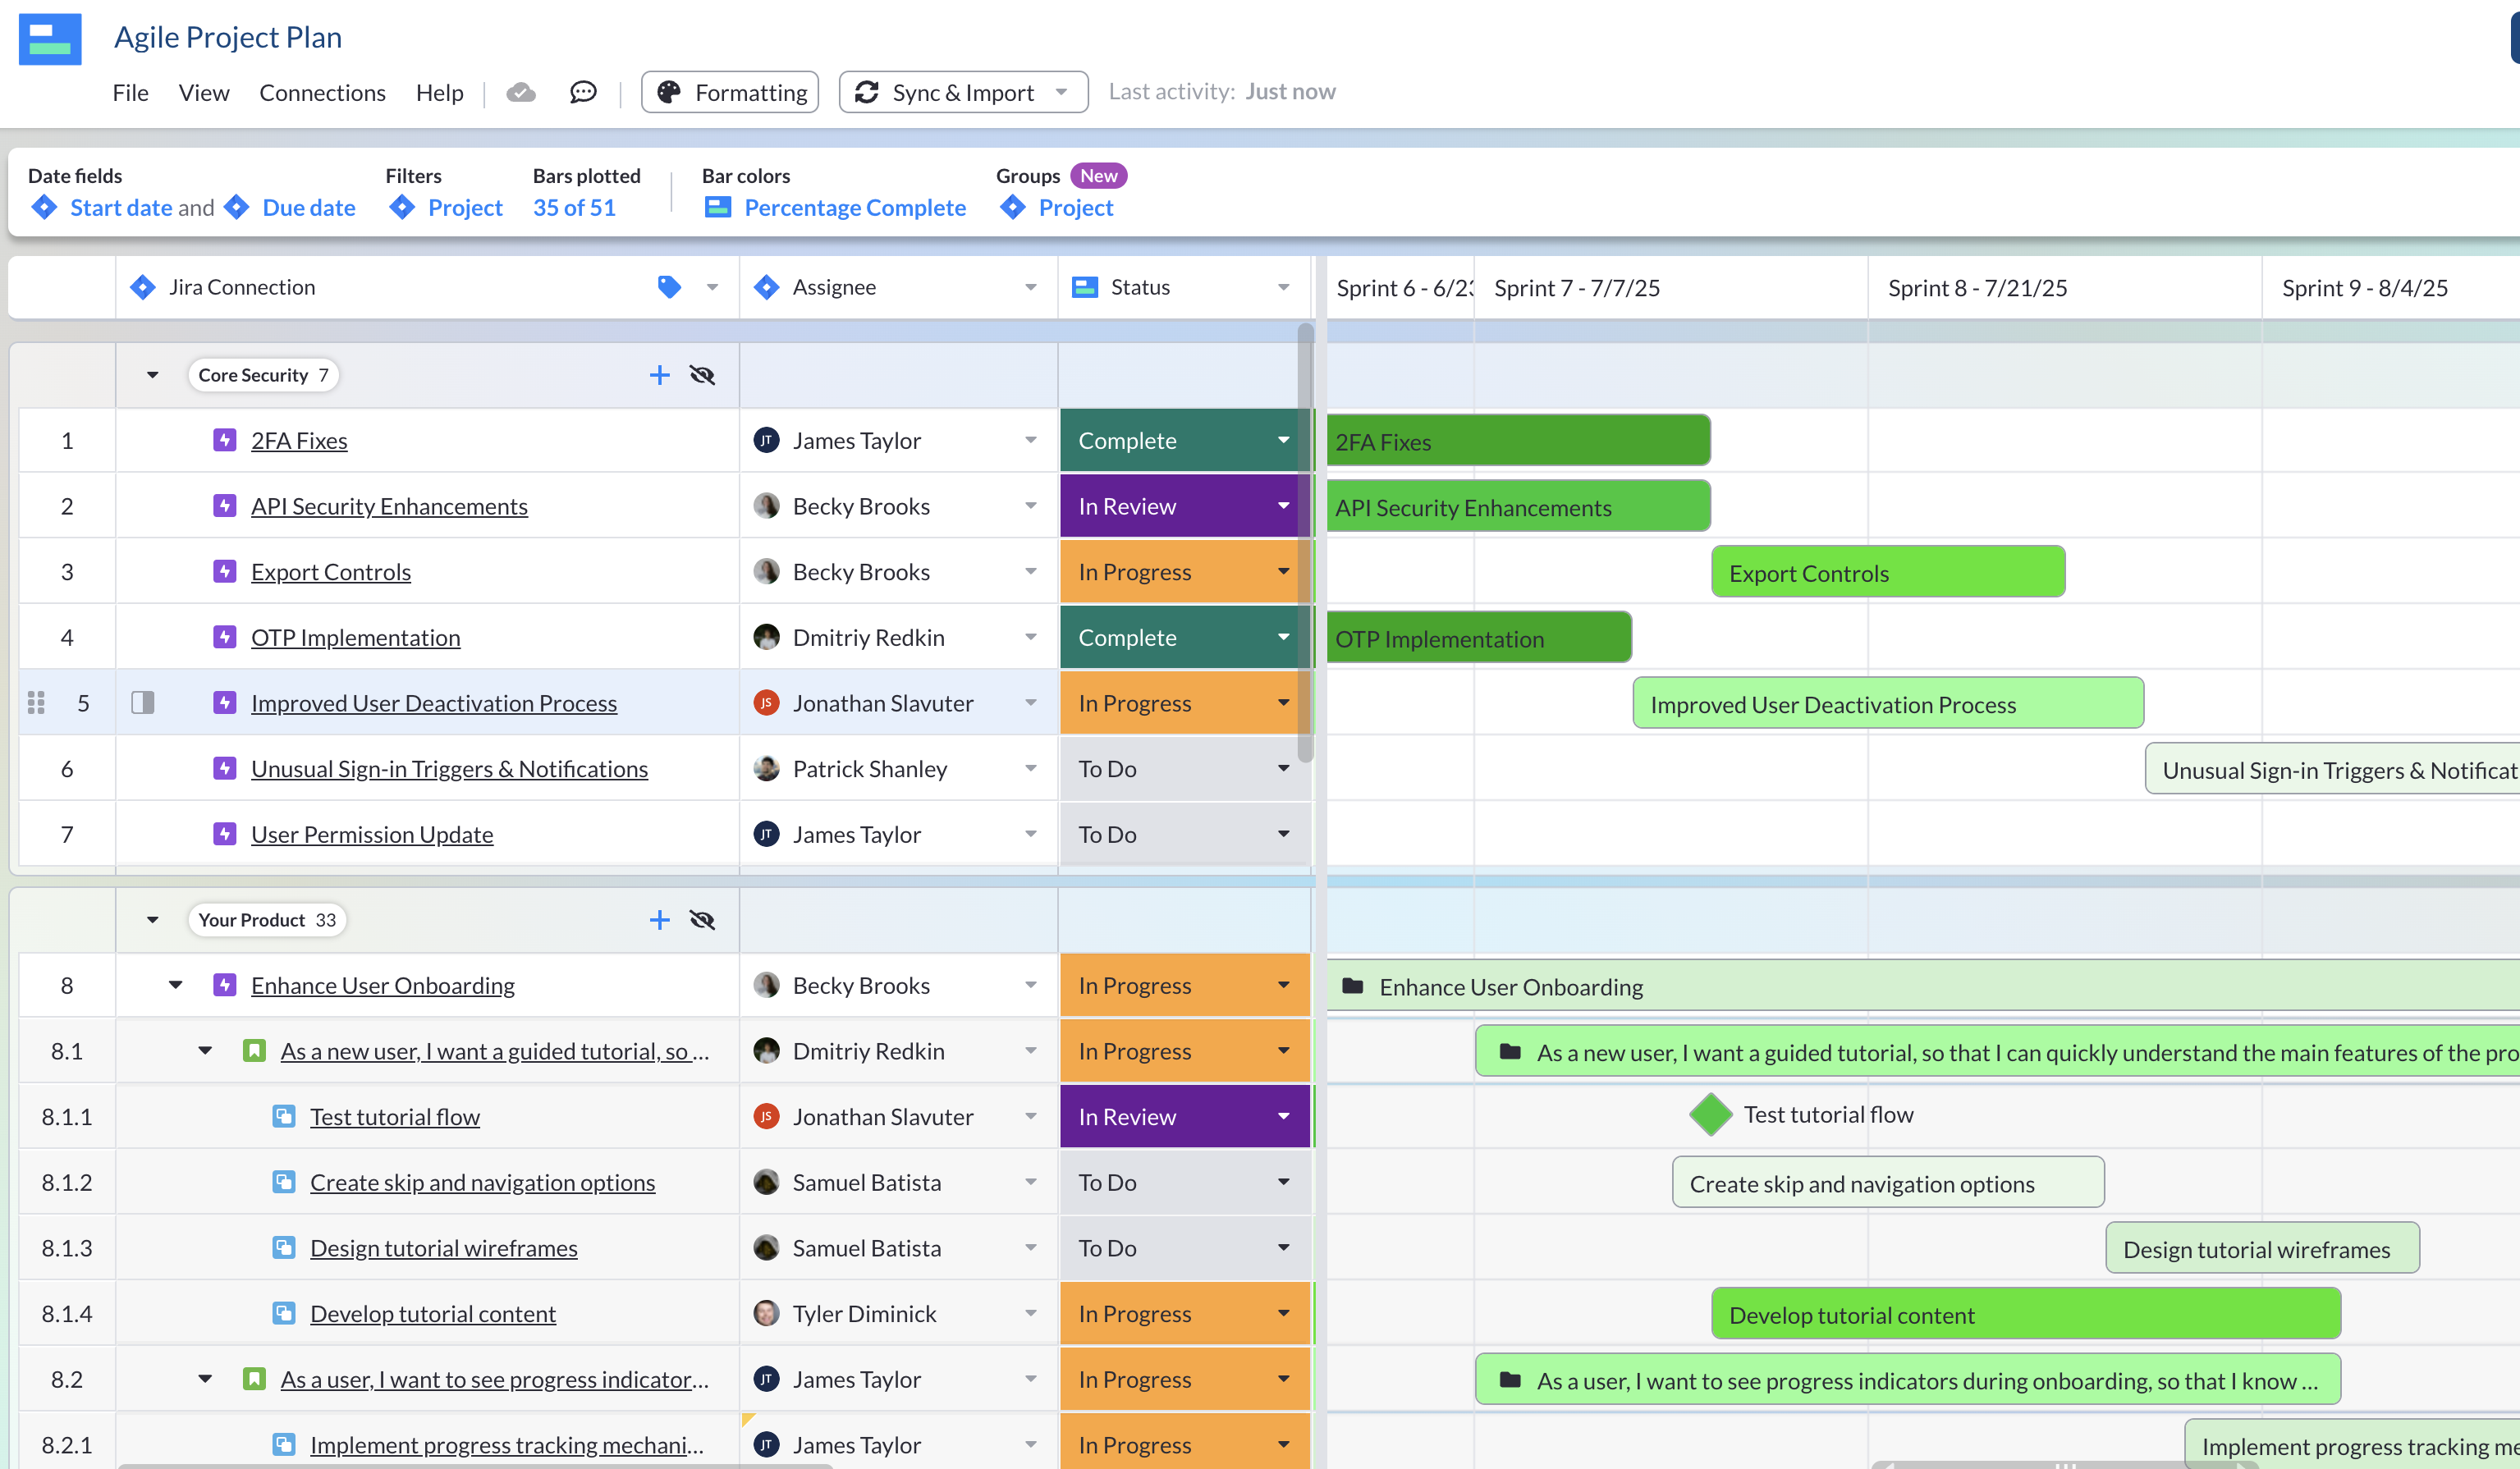
Jira Gantt chart, created in Visor, plots work over time.
To help you discover the ins and outs of agile Gantt charts, we’ll be covering:
- Whether Gantts & waterfall methods are incompatible with agile
- The benefits of using agile Gantt charts
- How to make agile Gantts (even if you don’t have date fields in Jira)
Are Gantt Charts Incompatible with Agile?
Seventeen software engineers gathered to write the Agile Manifesto in 2001 — nearly 100 years after Harry Gantt plotted his first bar on a project management chart.
For the uninitiated, the Association for Project Management, states that: “Agile project management is an iterative approach to delivering a project throughout its life cycle.” The agile approach focuses on delivering value to the customer in small steps rather than through a single, large-scale delivery at the end.
In other words, agile does not have a problem with (what others might call) scope creep.
“Welcome changing requirements, even late in development. Agile processes harness change for the customer’s competitive advantage.” – 2nd Agile Principle
So, can you make a Gantt chart and still be agile? Let’s see two sides to this argument.
Opinion #1: Gantt charts and Agile do not mix.
Because agile emphasizes flexibility, collaboration, customer involvement, and continuous improvement throughout the project lifecycle, many will argue that committing to dates (which you need to plot a Gantt chart), is incongruent with agile’s core ethos.
Reddit user arguing that Gantt charts and agile do not mix:
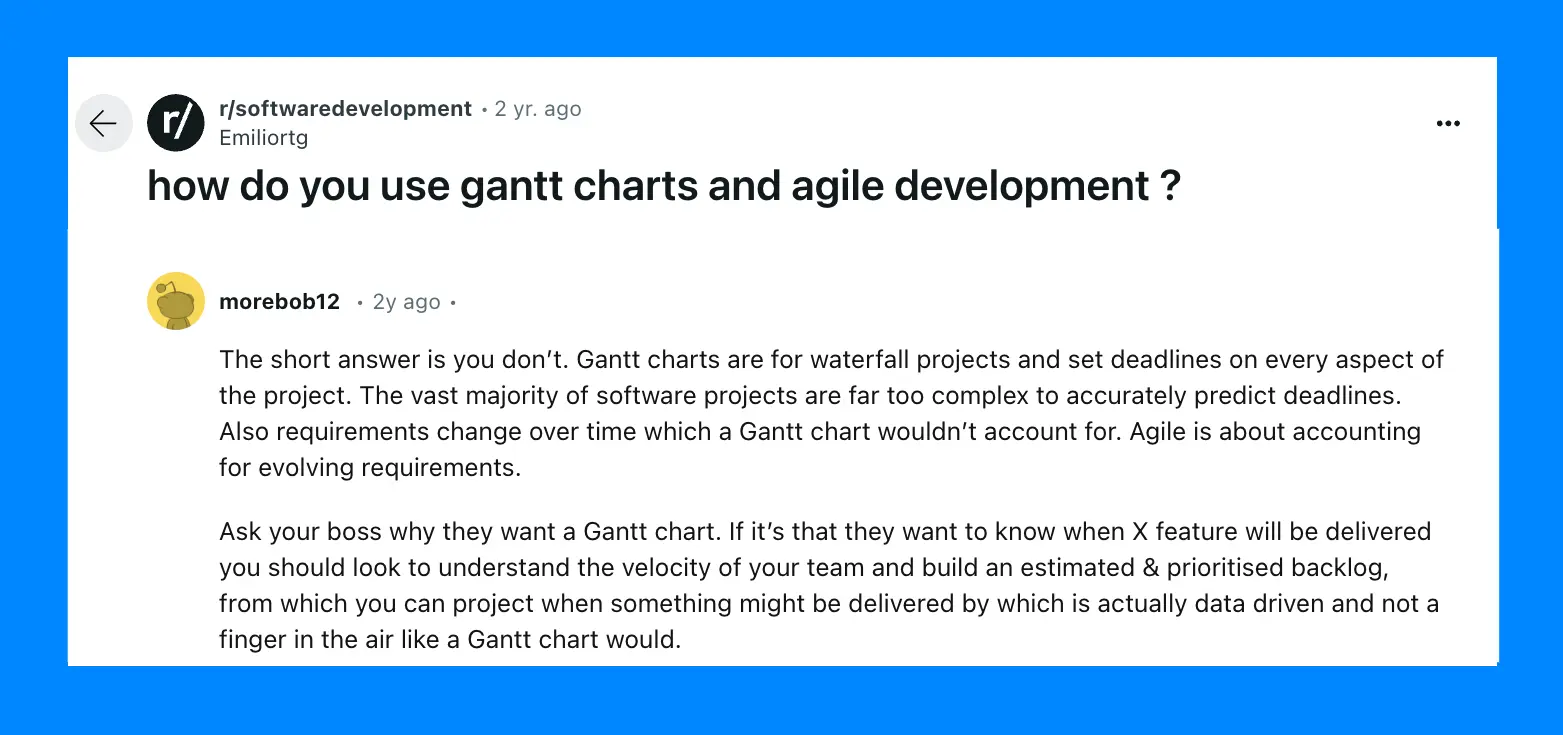
The backbone to a lot of agile team’s estimation technique is a backlog, and Kanban boards are most often used for maintaining and managing backlogs.
While there are pros and cons to Kanbans vs. Gantt charts, agile purists who are tracking velocity (and not imposed due dates) would be highly unlikely to use a Gantt chart.
Opinion #2: Agile Gantt charts work if we’re flexible.
While the Waterfall method sits in opposition to agile, some teams have found ways to make them coexist.
Waterfall’s more traditional, linear approach to managing projects is often depicted as a series of cascading phases. Just like how a waterfall cascades down, each phase is dependent on the deliverables of the previous phase.
Waterfall project management is structured with distinct stages and project milestones. But some would argue this linear approach can work in agile if you aren’t too specific about what you commit to.
Reddit user arguing that Gantt charts and agile work together:
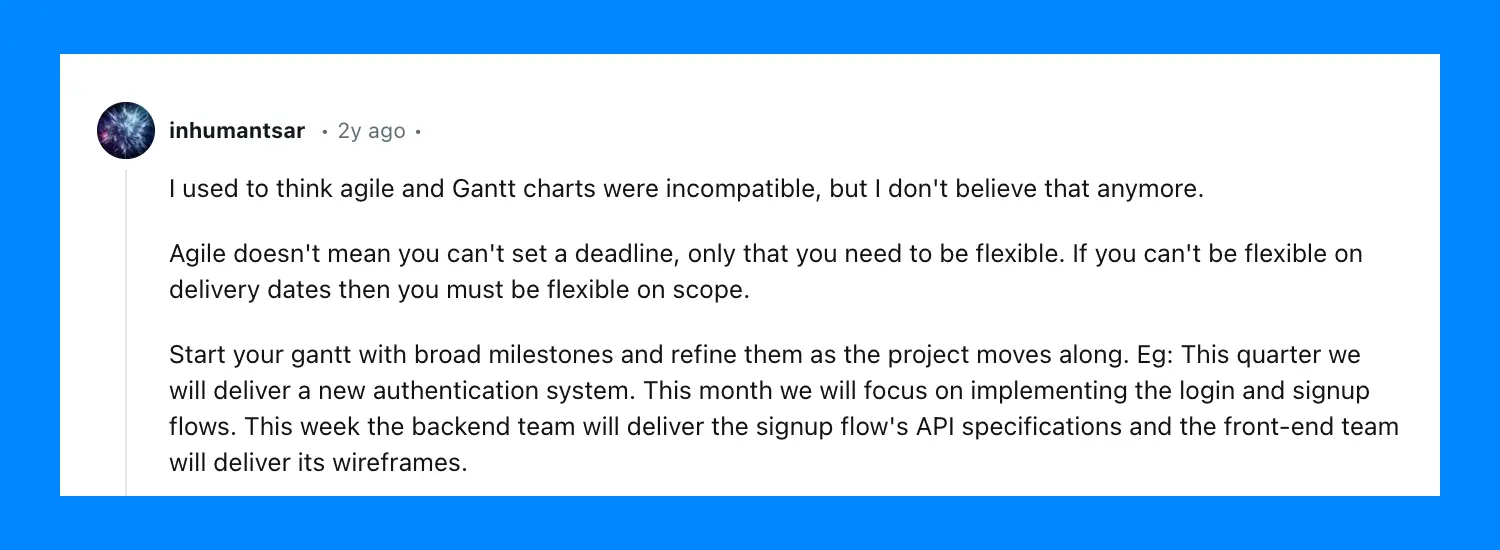
Traditionally, a Gantt Chart with milestones that refines the project’s progress would fall more under the Waterfall model. However, while the dates are static, the scope can shift.
The idea of delivering an “MVP” or “minimal viable product” would be a satisfactory in this scenario. In other words, the “release date” might not deliver the best possible version of the product. Rather, an MVP is something workable that other teams can rally around (and that can help get feedback for future iteration). Yes, it’s not the ideal version of the feature or product. But, it’s viable.
Because agile teams don’t typically live and work in a silo, they might encounter stakeholders and other teams that need to plan around releases. For example, if a marketing team uses Jira to plan campaigns around impending releases, they’ll likely need a date (or a date range) that the campaign will go live.
At many companies, it will be challenging to not give other teams and stakeholders any dates. Therefore, a Gantt chart can be a helpful component of agile release plans.
Enter the agile Gantt chart.
Characteristics of an Agile Gantt Chart
So what separates an agile Gantt chart from a plain old Gantt?
An agile Gantt chart is just like a traditional Gantt chart, but it incorporates agile principles and practices.
While Gantt charts are used most often in teams that use a Waterfall approach, agile Gantt charts are adapted to support the iterative and flexible nature of agile methods and agile project planning.
Here are some characteristics of an agile Gantt chart:
- Dynamic and Iterative: Unlike traditional Gantt charts (where the entire project is planned upfront), agile Gantt charts are dynamic and iterative. They allow for adjustments and changes to the schedule or scope as the project progresses and new information becomes available.
- Incorporate Agile Hierarchies: Real agile Gantt charts should be organized and nested using the components of an agile hierarchy, typically (but not limited to) epics, features, and user stories, which are Jira issue hierarchies.
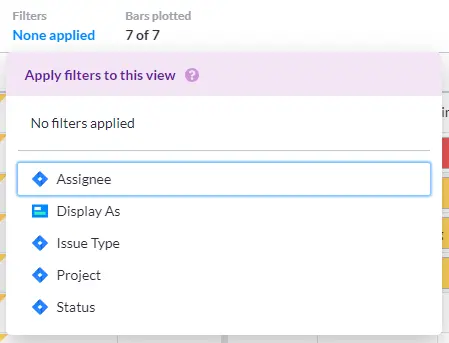
- Collaborative Planning: Agile collaboration tools that offer Gantt charts help with collaborative planning and decision-making among team members, stakeholders, and product owners. They also offer a way to visualize the project schedule, so everyone can have discussions around priorities, trade-offs, and resource allocation. For instance, in Visor, teammates get a clear, simple view of Jira data displayed in a way that’s easy for them to understand. You can color code your Gantt chart, add milestones, and filter out granular Jira issue hierarchies (e.g., subtasks).
Easy filters in Visor:
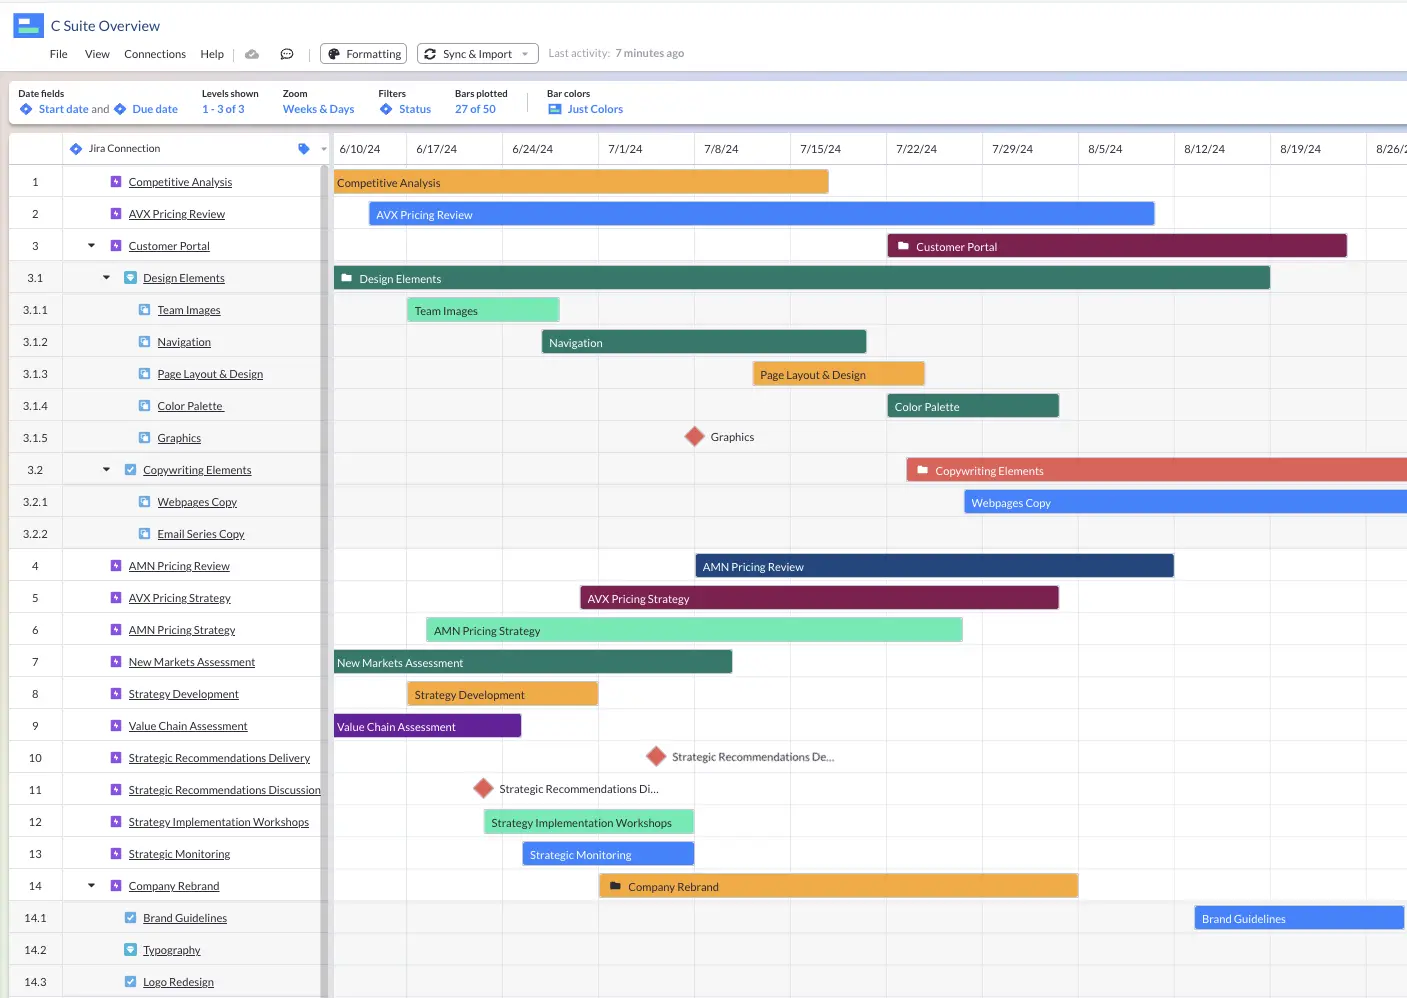
- Time-Boxed Scheduling: Agile Gantt charts typically use time-boxed scheduling, where work is planned in fixed time increments such as sprints (for Scrum) or cycles (for Kanban). Each iteration is represented as a block of time on the chart.
Visor’s Gantt view with Jira data and date fields:
- Focus on Deliverables: Agile charts emphasize the delivery of value and focus on tracking the progress of specific deliverables or user stories rather than tasks. Each deliverable or user story may be represented as a separate bar or milestone on the chart.
- Real-Time Updates: Agile Gantt charts are updated in real-time to reflect changes in the project status, such as completed tasks, new additions to the backlog, or adjustments to the schedule. This ensures that the chart always provides an accurate and up-to-date view of the project progress. For example, in Visor, Gantt charts are plugged directly into your Jira data and will update automatically as issues in Jira change.
Syncing options in Visor:

Jira Tips for Making Agile Gantt Charts
Despite there being some stigma in agile communities about using Gantt charts, the apps that agile teams use offer Gantt charts. You can create Jira Gantt charts, for instance.
Whether you use Jira’s built-in Timeline and Advanced Roadmaps functionality (which are Gantt charts) or a tool like Visor (which connects to Jira data), most agile teams have the option to create Gantts. However, they might encounter some problems or questions about making chats, which we address below.
Tip #1: Don’t have start / end date fields in Jira? Use this add-on tool.
Because agile Kanban boards with swimlanes don’t require dates, they are popular with agile teams; not all teams have date fields associated with their projects. If you want to keep it that way, but still need to plot a Gantt for stakeholders or other teams, then you can try Visor.
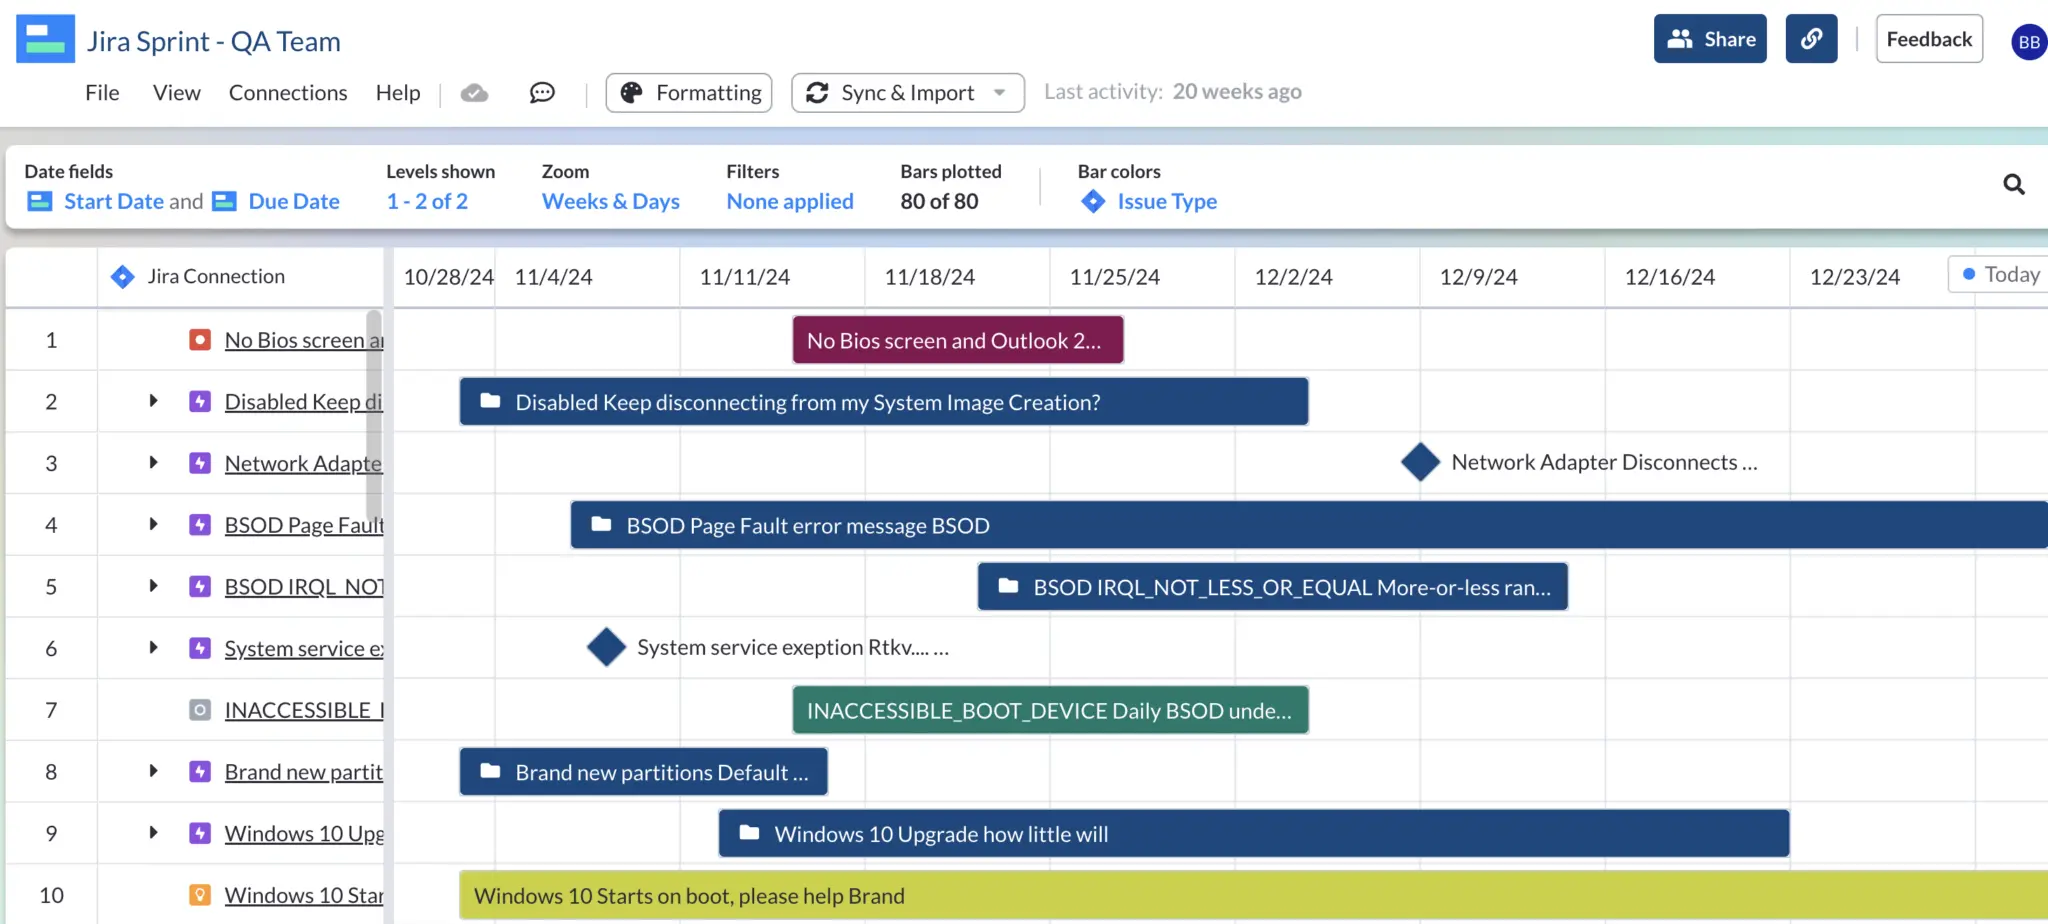
Visor is a separate app that connects to Jira. In addition, you can add custom fields that are unique to Visor (and not Jira) — like start and end dates.
Gantt chart using Visor date fields with imported Jira issues:
#2: Have Jira date fields? You don’t have to show them to stakeholders.
Perhaps your team does indeed have estimated dates (and corresponding Jira start / end date fields). However, maybe you don’t look at these dates too often and they feel flexible. After all, it’s typical for agile teams to track velocity and use burndown or burnup charts as part of their daily standups.
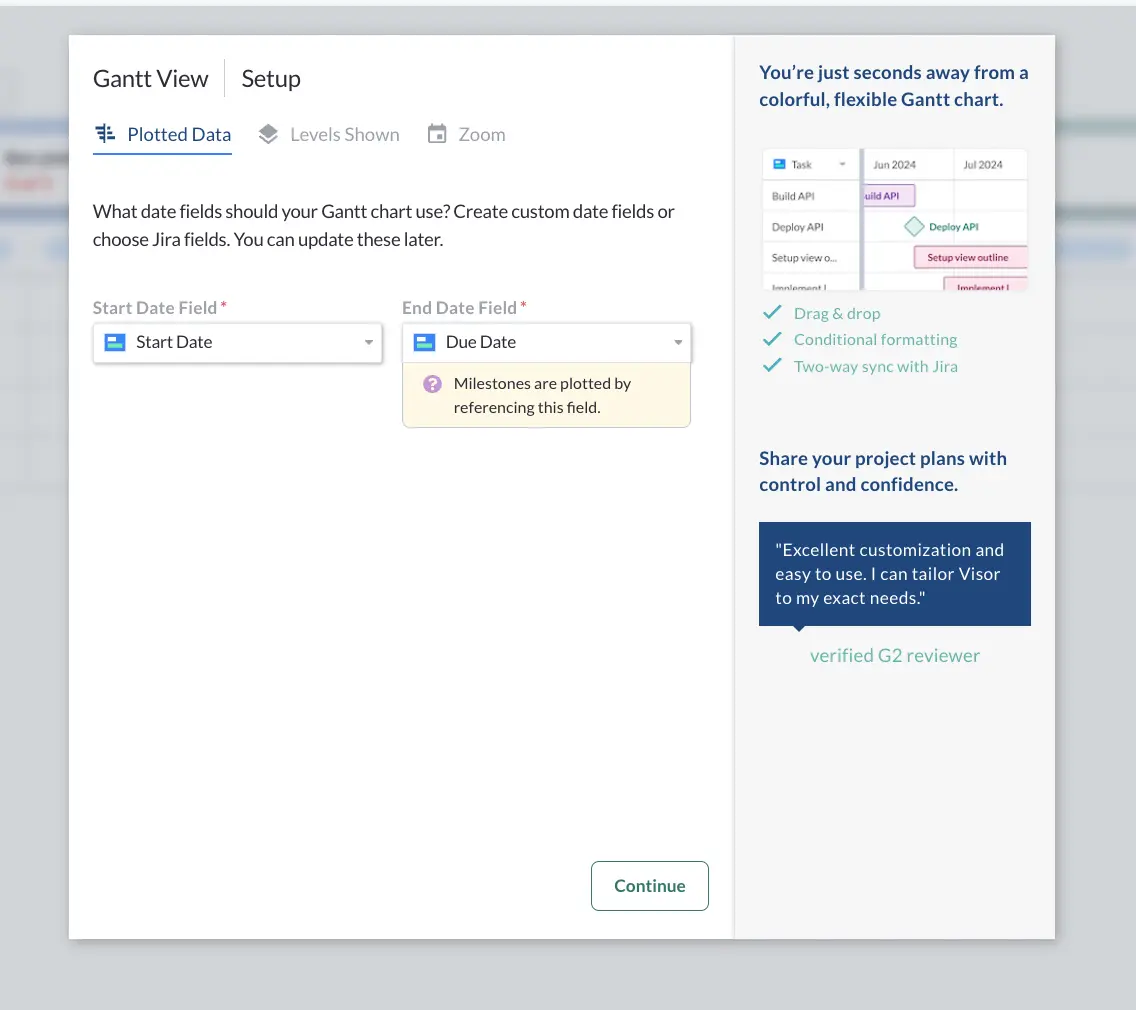
If this sounds like you, then you can still use custom date fields in Visor instead of Jira date fields when communicating dates to external teams or stakeholders. Add wiggle room and keep your team’s start / end date fields flexible.
Best of all, Visor is an easy way to give Jira guest access to stakeholders. You can share your Gantt directly in Visor or embed your Gantt in Confluence, another tool from Atlassian.
You can add custom date fields in Visor instead of Jira date fields:
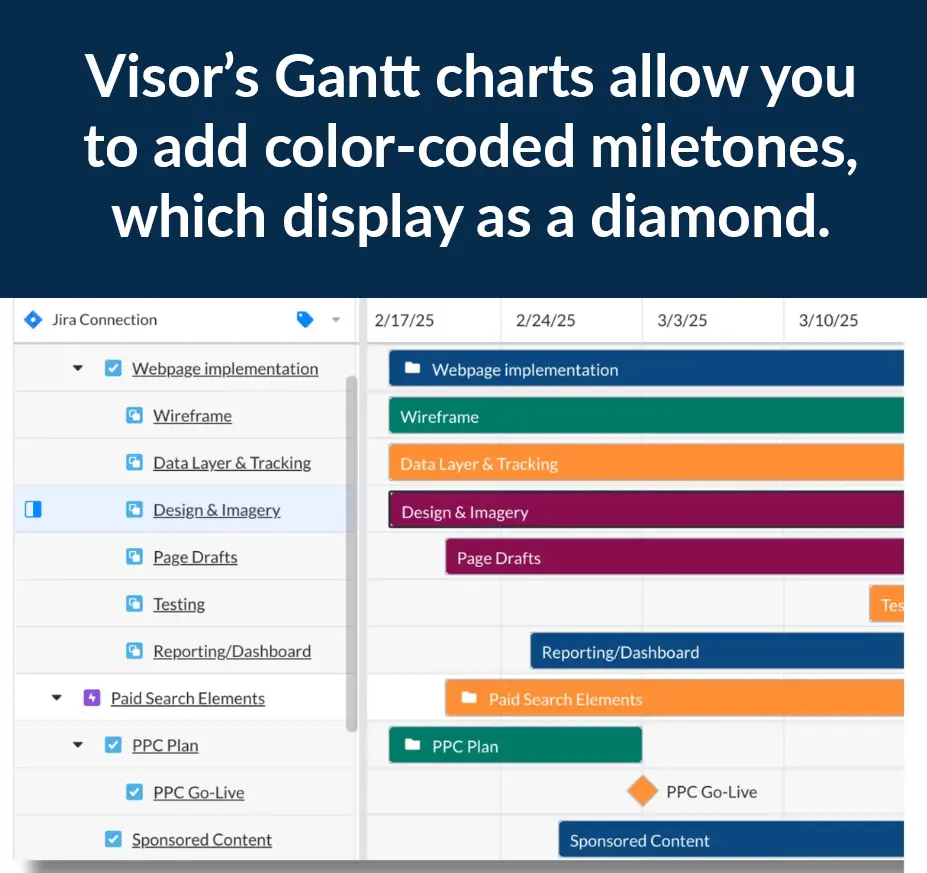
Tip #3: Paint broad strokes with Milestones to make looser commitments.
You can create very broad expectations to help refine your Gantt. As a Reddit user said:
“Start your Gantt with broad milestones and refine them as the project moves alone. (E.g., ‘This quarter we will deliver a new authentication system. This month we will focus on implementing the login and signup flows.”
This approach allows you to still communicate commitments without getting too granular. However, there is one caveat: Jira does not offer Milestones. Alas, Visor (which integrates with Jira) does.
Use Cases for Agile Gantt Charts
1. For Portfolio & Stakeholder Management:
Stakeholder engagement is one of the main reason project managers need not worry about AI taking their jobs. Human relationships are complicated with or without due dates involved.
Nonetheless, I have yet to meet a CEO or executive who didn’t love a chart. Many in the C-suite are only capable of taking in high-level information. Creating a Gantt chart that shows just epics might make the most sense. In addition, creating high-level roadmaps visualizing your portfolio of projects can help teams with portfolio management.
High-level Jira Gantt chart, created in Visor, showing only epics:
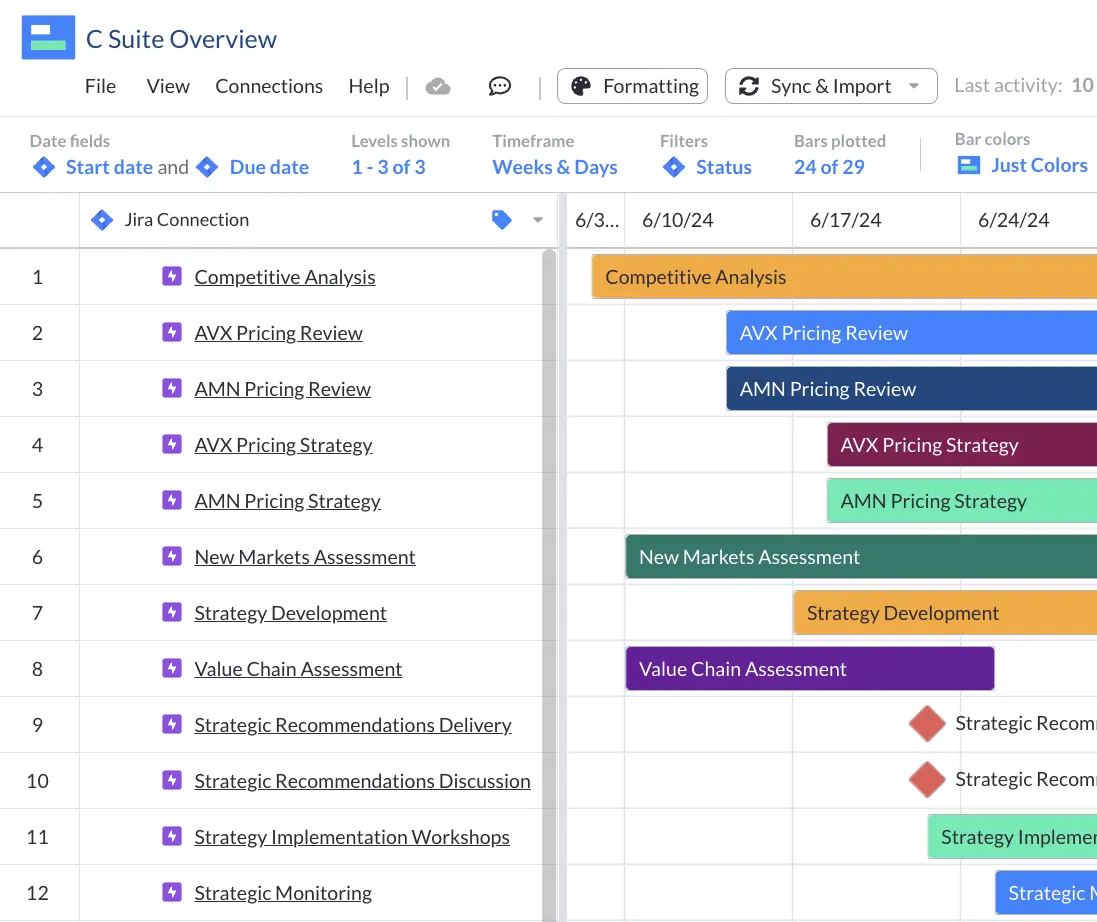
Visor allows you to import multiple Jira projects for portfolio management thanks to our JQL importer. Need a brush up on JQL? We got you. Get our JQL Cheat Sheet.
2. Gantt-like charts can help with capacity planning
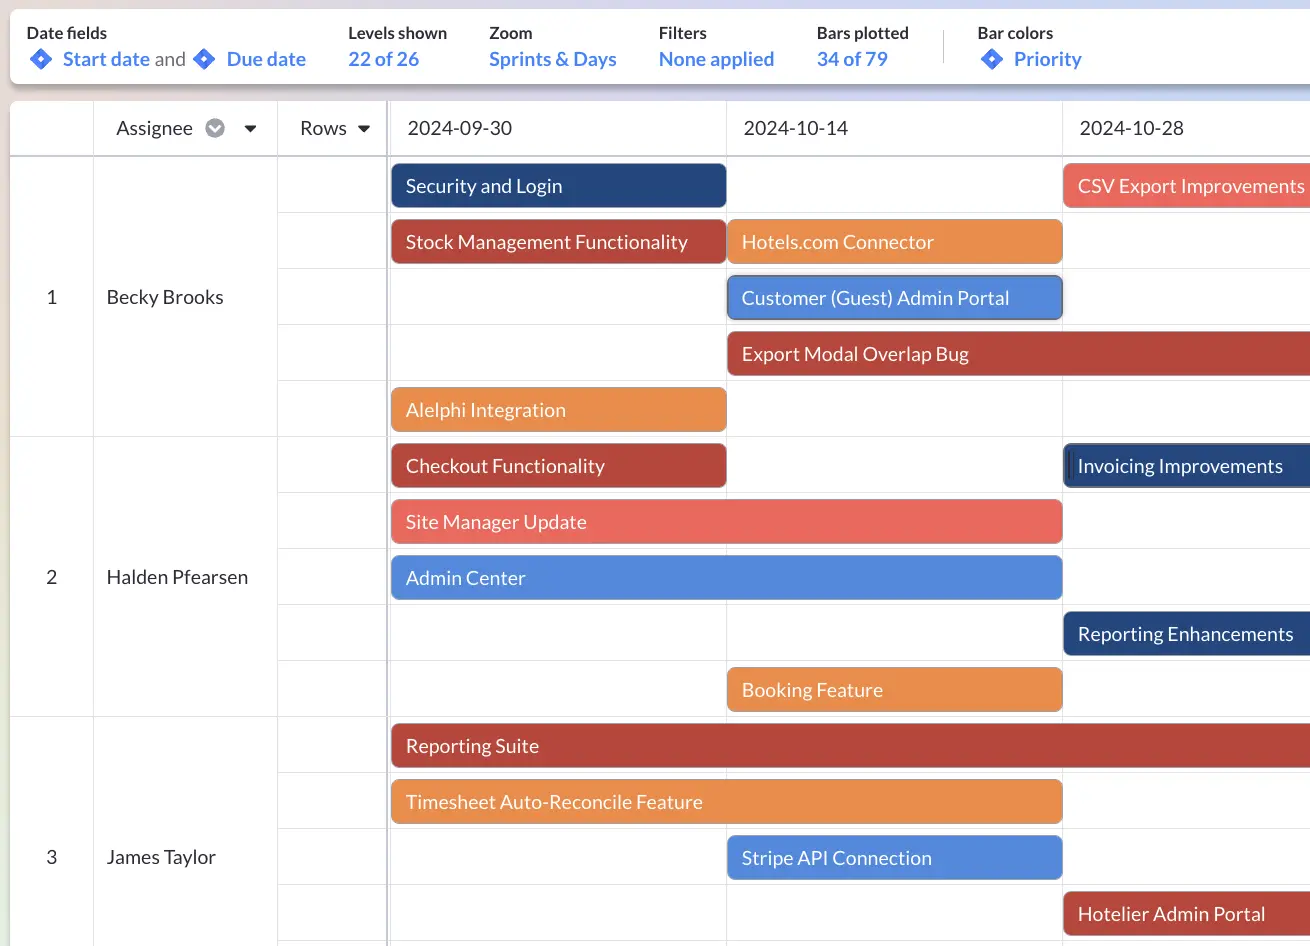
One gap in Jira’s feature set is a Gantt-like chart that has swimlanes to help with Jira capacity planning. At Visor, we call this our Timeline view and like the Gantt, you need dates to plot it. Unlike a Gantt, it can help with seeing who might be at capacity (and who is not).
While Agile teams might not love the idea of a Gantt for external sharing purposes, it is helpful seeing planned work over time to see what’s reasonable. Of course, other teams mitigate this with Story Points. However, having a visual can add a new level of understanding.
Timeline view at Visor, using Jira data for capacity planning purposes:
3. To bridge the gap between teams
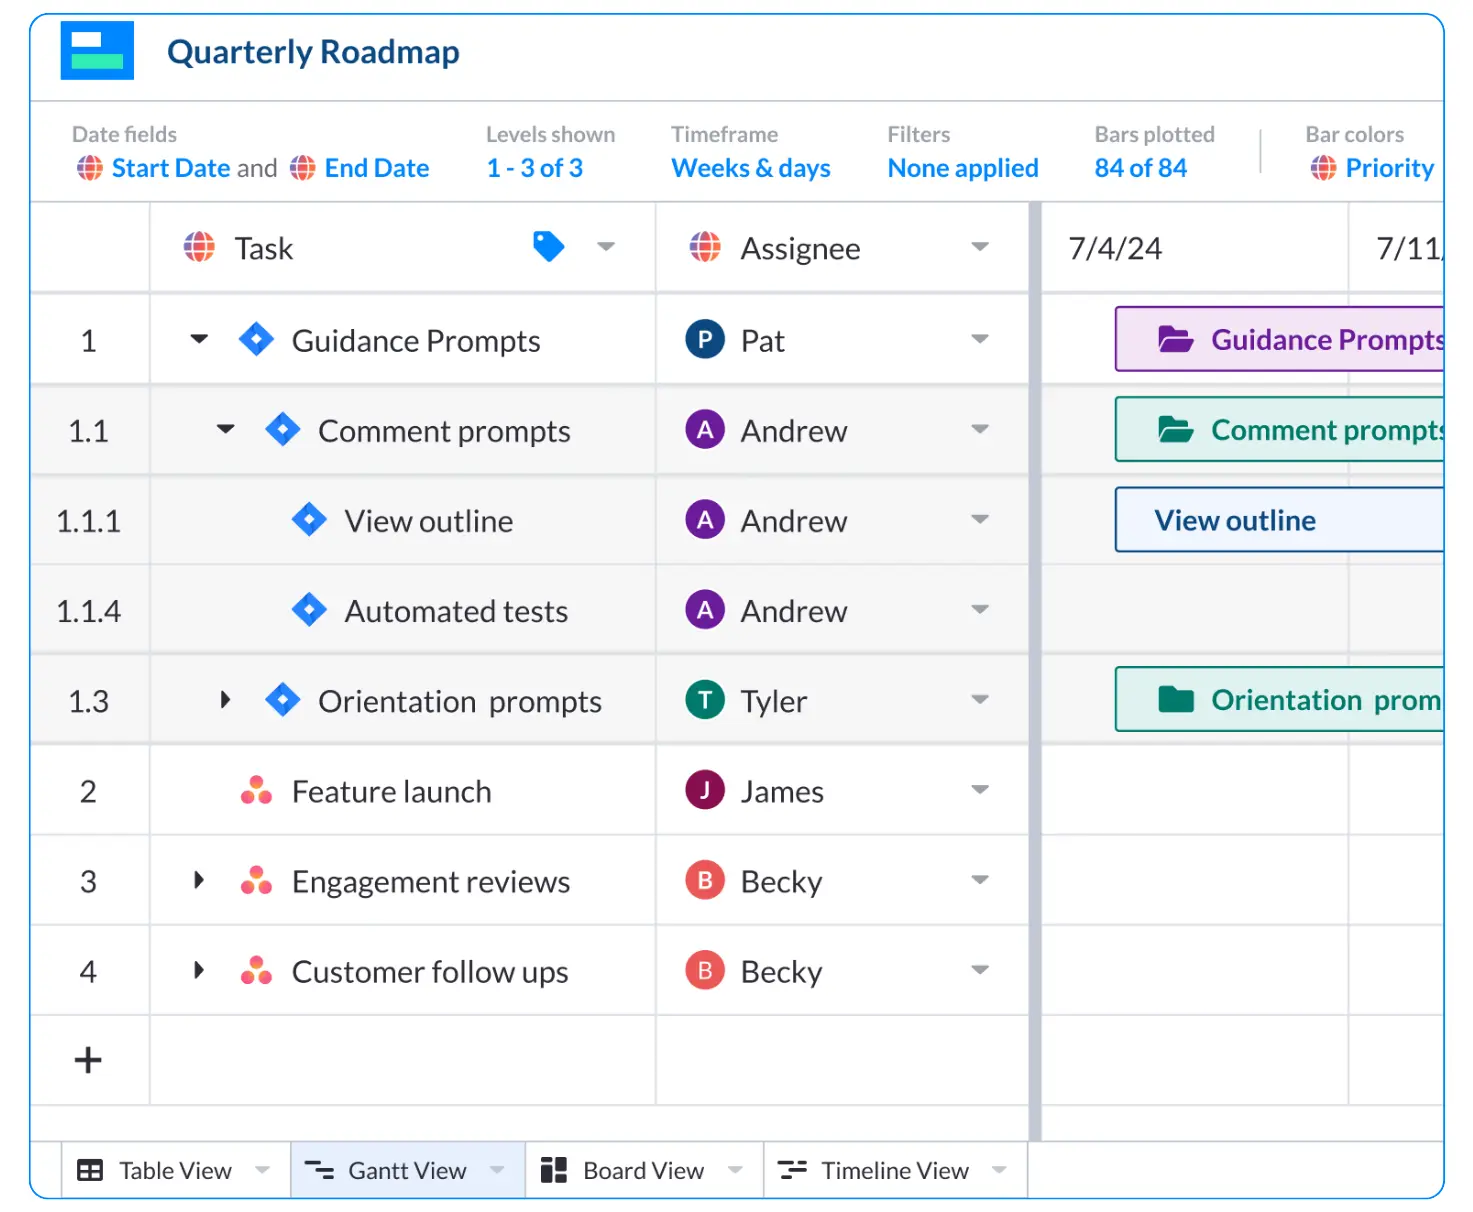
When you’re dealing with organizations that use both methodologies – say your DevOps team is agile, but your Marketing team uses a Waterfall method – a Gantt chart is a good way to bridge the gap, sharing details from the agile side of things in a way that all stakeholders understand.
This is doubly important when different teams are using different project management systems. For instance, if development teams are using Jira, and marketing lives in Asana and HubSpot, marketing doesn’t have an easy way to understand what Dev is up to.
Visor offers an easy way to connect data from different apps. Our Jira and Asana integration helps technical teams in Jira stay in sync with business teams using Asana.
Visor Gantt view using both Jira and Asana data:
4. Visualization of Iterative Work
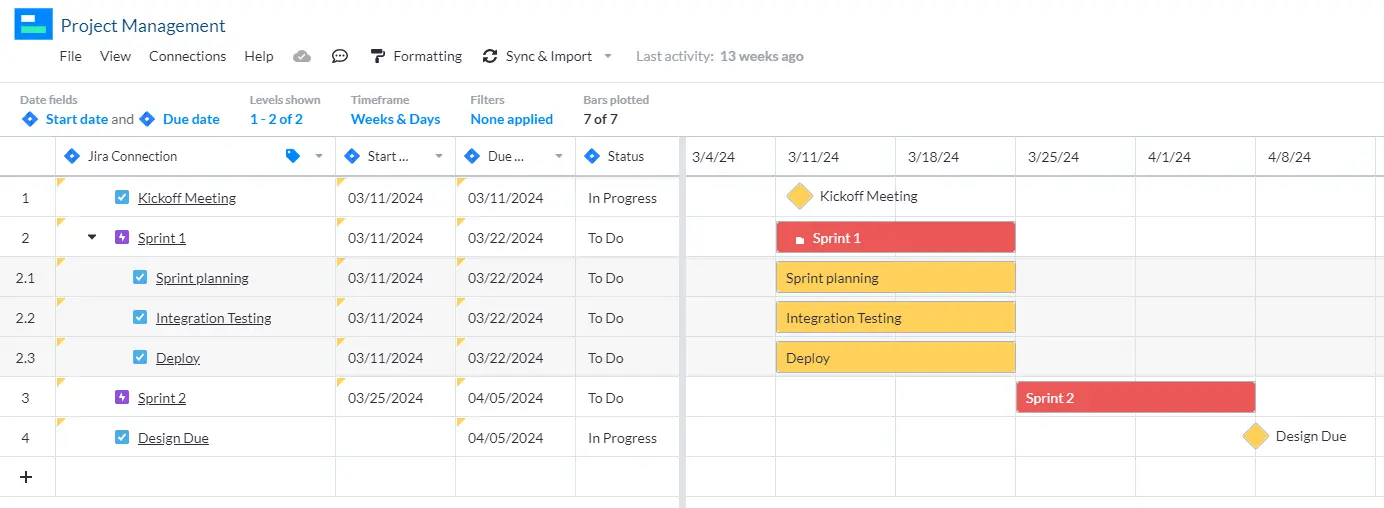
Agile Gantt charts give you a way to visualize sprints or iterations.
This helps agile teams see how work is planned and scheduled over time, even if they’re working in shorter time frames.
Jira Gantt chart, created in Visor, showing iterative sprints:
5. Agile Portfolio Management
Using agile portfolio management strategies enables you to take a high-level view of all your projects in order to:
- Make strategic decisions about which projects to invest more time/resource into
- Balance resources more effectively across all your projects
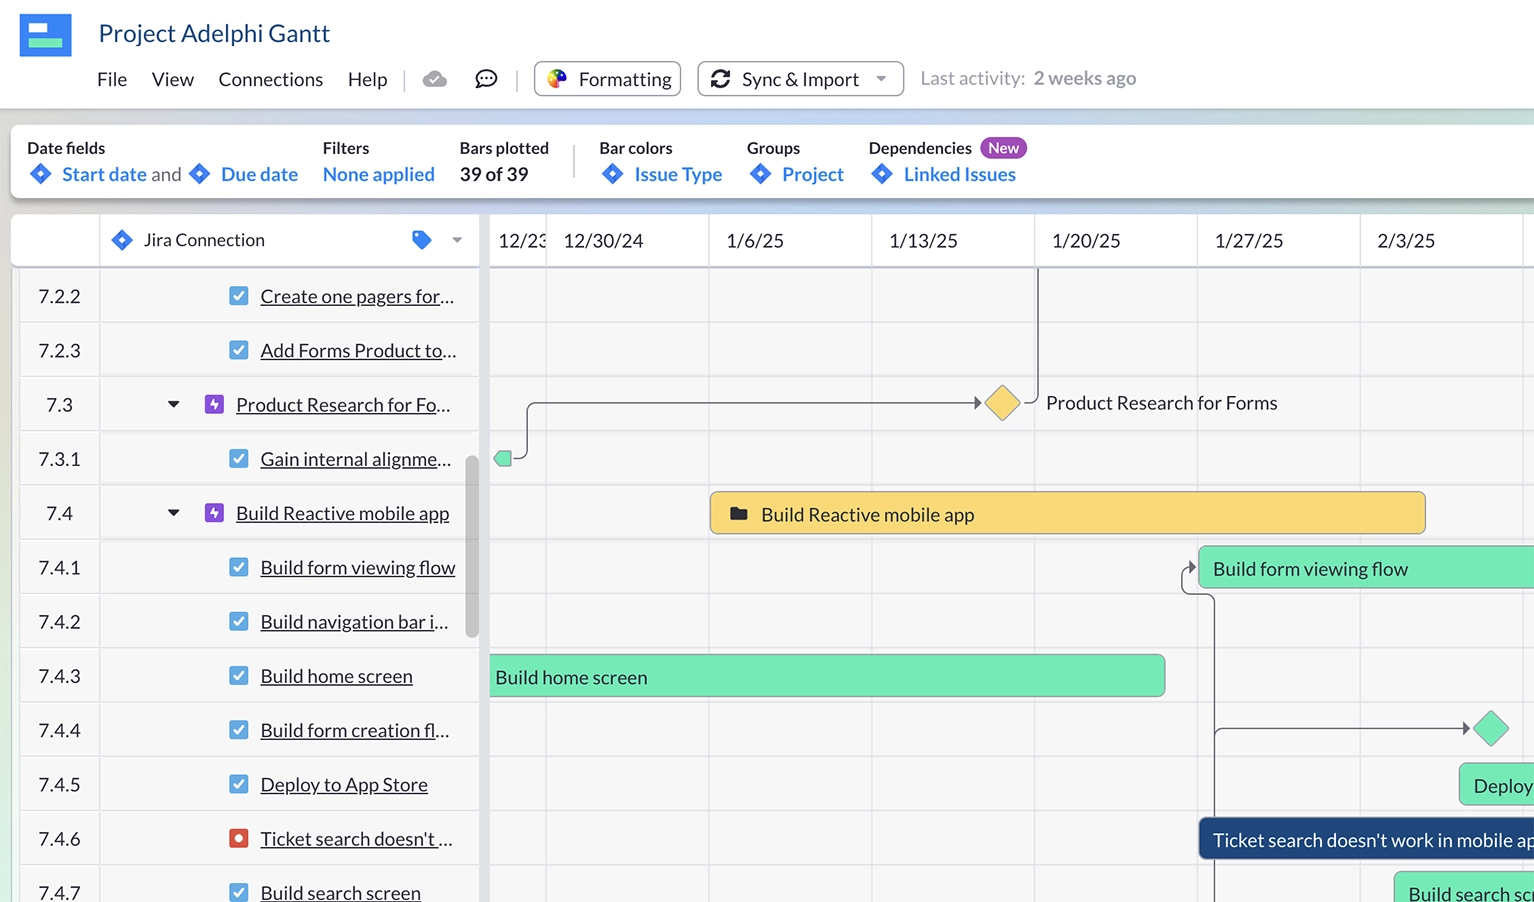
- Understand and manage cross-project dependencies and milestones
- Ensure your projects all align with your business strategy
Gantt Chart with Jira Dependencies created with Visor’s Project Gantt Chart Template
At it’s most basic project portfolio management simply means taking a collectivized perspective of all your projects – your portfolio of projects – in order to understand and improve the ROI they deliver both individually and holistically as a full program, or portfolio.
Although for a long time agile methodologies and project portfolio management were seen as incompatible, in recent years they have been adopted across agile teams of all sizes to gain a big-picture view instead of a siloed project-by-project approach.
Agile portfolio management software with Gantt chart views can help you to do agile portfolio management without adapting your agile software to portfolio management, or trying to get some dusty waterfall-only project portfolio management tool to fit with your agile workflows.
Are Agile Gantt Charts used in Scrum?
While many agile advocates say that Gantt charts aren’t accurate enough for use in Scrum, if you’re connecting your sprint data directly to your Gantt charts, there’s no reason you can’t use agile Gantt charts in Scrum. (Tools like Visor usually let you make that connection, too.)
There are a couple of caveats. If you want to forecast when you’d deliver a project (as you would have to do in a typical Gantt chart), you’ll need a well-groomed backlog that’s prioritized and grouped into features or epics. You can then use sprints to predict approximately when work will be done.
Agile Roadmap Template Using Visor’s Gantt View:
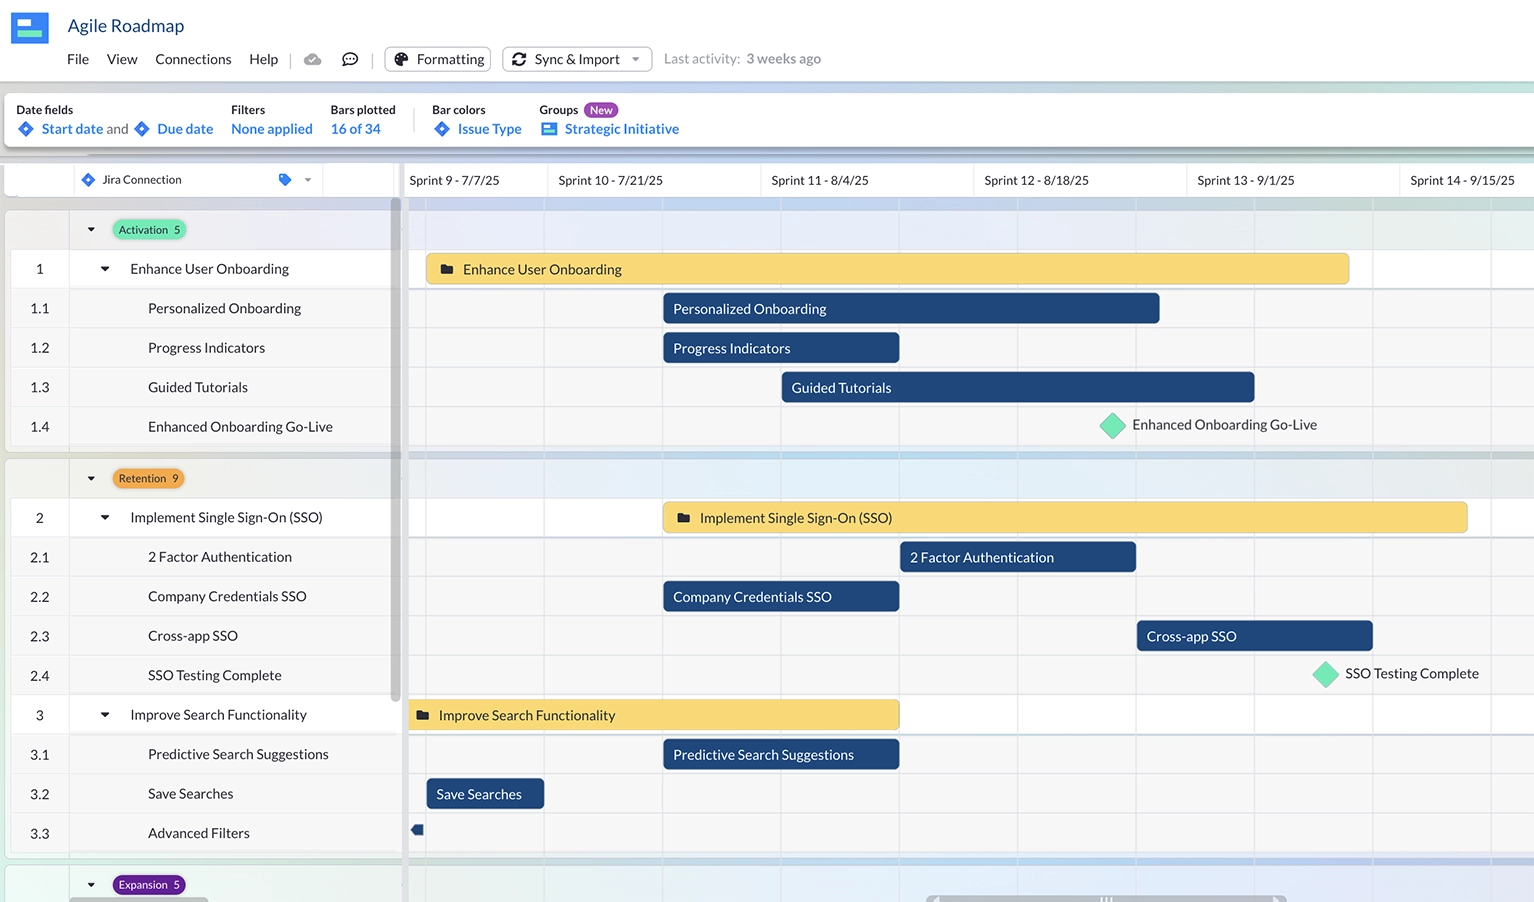
Another thing to consider is that your agile Gantt chart is more of a roadmap than a hard and fast plan. It’ll evolve as your projects evolve. If it can’t, you may need to switch to a more flexible tool for your Gantt charts. So if you’re using a tool that isn’t connected to data from your project management software, you may struggle to keep your Gantt chart agile.
Tools for Creating Agile Gantt Charts
There are several ways to create your own agile Gantt Charts, ranging from complicated (for example by creating your own Gantt in Google Sheets, or Excel or other alternatives to Sheets) to pretty darn easy. Take a look at two of the easiest for project managers – especially if they use Jira.
Agile Gantt Chart in Jira
We already covered above a bit of the nuances around creating a Gantt chart in Jira. If you really want to dive into the nuances of the two built-in Jira roadmaps: Timeline and Advanced Roadmaps, I recorded a view on just that topic.
Visor’s Agile Gantt Charts
As we discussed already in this post, you can create agile Gantt charts using Visor’s Gantt chart tool. Whether you import data from apps like Jira and Asana or input your data straight into Visor, you will be able to make a colorful Gantt chart that you can share with whomever you please.
Visor’s AI Smart Template feature can save you huge amounts of time and effort here too. It creates a customized Gantt chart, tailored to you, your projects, and you data in just a few minutes. Try it now for free or find out more about this on our page for Visor’s AI-powered agile gantt chart templates.
Below is a review of Visor from Alex “Dr. Jira” Ortiz, who is a popular educator in the Atlassian space:
Gantt Charts That Stay Agile
Ultimately, the future of agile relies on agile teams staying true to its ethos of iterative changes and people over process. While some purists might scoff at using a Gantt chart, if they work, then they work. After all, Gantt charts offer a unique blend of traditional project management with the iterative nature of agile.
While not a core component of agile practices, Gantt charts provide valuable insights and benefits when used effectively in agile environments. And a tool like Visor lets you connect your data directly to your Gantt, ensuring it stays up-to-date and agile.
Gantt charts, coupled with Visor’s seamless data connectivity, empower teams to adapt swiftly to changes and maintain alignment with project goals throughout the iterative process.
In addition, Visor offers different types of views. You can use our Table view to share Jira guest access when using our templates to onboard customers (who likely don’t have access to Jira). Our Table view works well for internal reports as well, which you can explore with our templates (like our Mutual Action Plan template).
We also offer agile-specific visualizations, such as a Sprint Backlog Template and Sprint Retrospective Templates using our Kanban Board (which is a more typical type of visualization agile teams use).
Explore Visor today. We’re free to get started with!


